Figure 4.

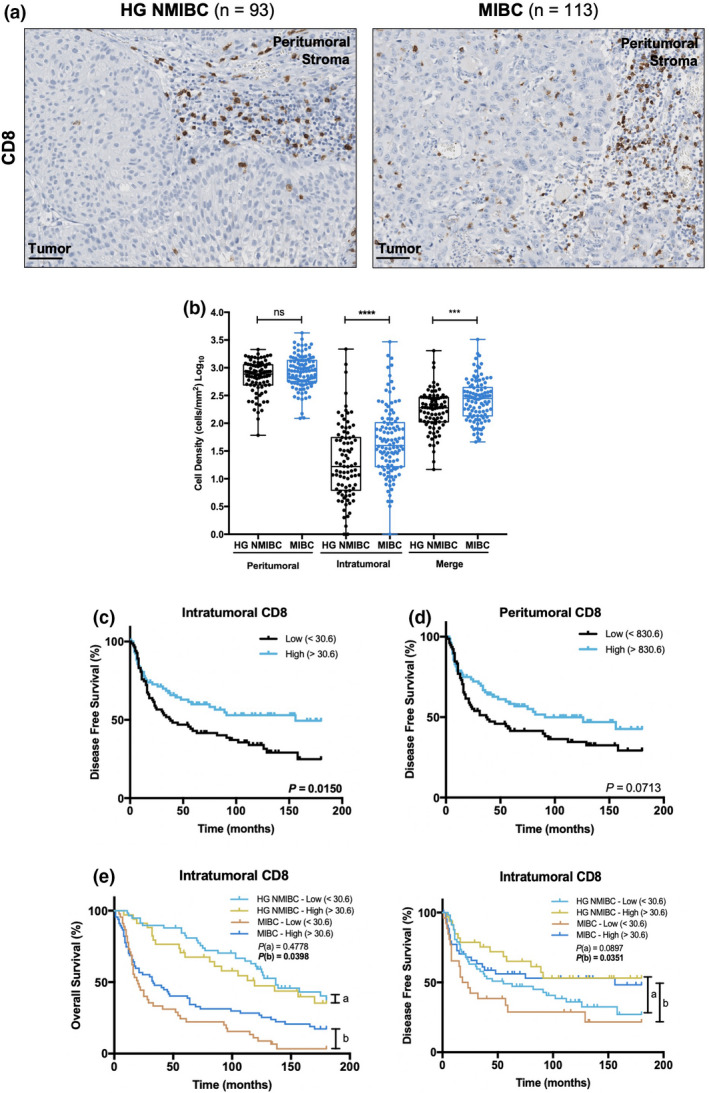
Intratumoral CD8 expression is augmented in MIBC and is associated with improved prognosis. (a) Representative examples of CD8 staining in HG NMIBC and MIBC tissue specimens. Notice the increased intratumoral infiltration in MIBC samples. Scale bar = 50 μm. (b) Distribution of CD8+ cells density in HG NMIBC (n = 93) and MIBC (n = 113) samples. The number of positive cells per mm2 was calculated with QuPath's Positive Cell Detection tool. ‘Merge’ refers to the whole‐slide evaluation, considering peritumoral and intratumoral regions together. P‐values were calculated by the non‐parametric Mann–Whitney U‐test; ns P > 0.05, *P < 0.05, **P < 0.01, ***P < 0.001, ****P < 0.0001. Kaplan–Meier estimates of DFS in BlCa patients stratified by peritumoral (c) and intratumoral (d) CD8 expression. (e) Stratified Kaplan–Meier analyses of OS and DFS according to intratumoral CD8 expression and ‘HG NMIBC vs MIBC’ classification. (a) Comparison between ‘HG NMIBC Low’ and ‘HG NMIBC High’; (b) Comparison between ‘MIBC Low’ and ‘MIBC High’. Dichotomisation into low and high expression was based on the median value. P‐values were calculated by the log‐rank test. HG NMIBC, high‐grade non‐muscle invasive bladder cancer; MIBC, muscle‐invasive bladder cancer.
