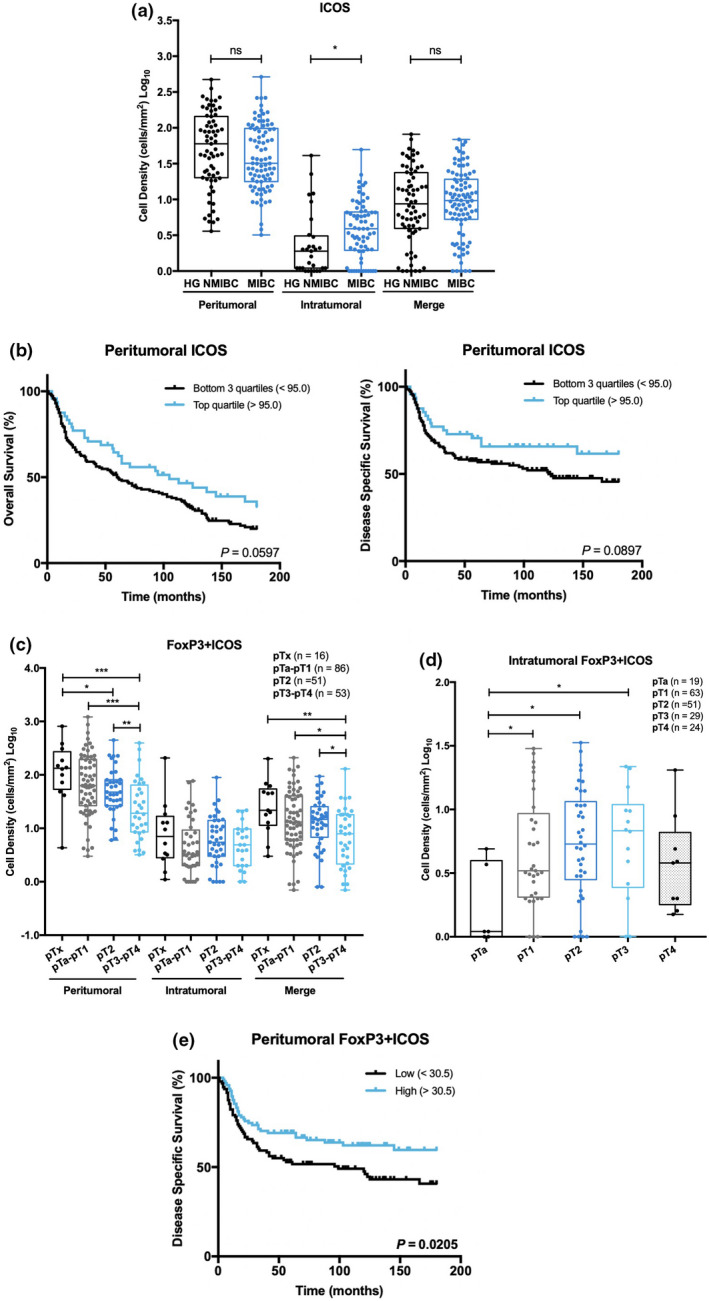
Figure 5.

Intratumoral ICOS expression increases in MIBC and tends to associate with prolonged survival. FoxP3+ICOS+ cells exhibit different distribution patterns, according to spatial location. (a) Distribution of ICOS+ cells density in HG NMIBC (n = 93) and MIBC (n = 113) samples. (b) Kaplan–Meier estimates of OS and DSS in BlCa patients stratified by peritumoral ICOS single expression. Dichotomisation into low and high expression was based on the percentile 75. (c) Distribution of FoxP3+ICOS+ cells density in pTx (n = 16), pTa‐pT1 (n = 86), pT2 (n = 51) and pT3‐pT4 (n = 53) neoplasms. (d) Distribution of intratumoral FoxP3+ICOS+ cells density across pT stages: pTa (n = 19), pT1 (n = 63), pT2 (n = 51), pT3 (n = 29) and pT4 (n = 24). (e) Kaplan–Meier estimates of DSS in BlCa patients stratified by peritumoral FoxP3/ICOS expression. Dichotomisation into low and high expression was based on the median value. P‐values were calculated by the non‐parametric Mann–Whitney U‐test are depicted in a, c and d; only significant associations (P < 0.05) are denoted for simplification purposes in c and d – *P < 0.05, **P < 0.01, ***P < 0.001, ****P < 0.0001. P‐values denoted in b and e were calculated by the log‐rank test. ‘Merge’ refers to the whole‐slide evaluation, considering peritumoral and intratumoral regions together. HG NMIBC, high‐grade non‐muscle invasive bladder cancer; MIBC, muscle‐invasive bladder cancer.
