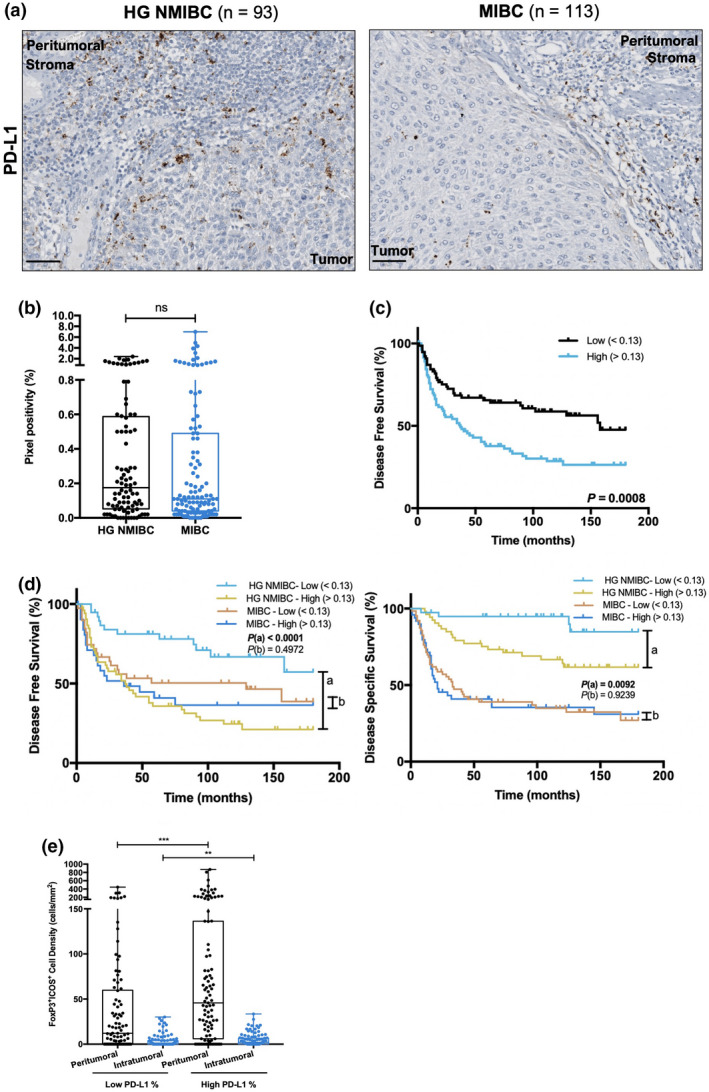
Figure 6.

Higher PD‐L1 expression negatively impacts disease outcome, especially in HG NMIBC patients, and is associated with increased FoxP3+ICOS+ cell density. (a) Representative examples of PD‐L1 staining in HG NMIBC and MIBC tissue specimens. Notice the dot−/ant‐like staining pattern. Scale bar = 50 μm. (b) Distribution of PD‐L1 positive percentage in HG NMIBC (n = 93) and MIBC (n = 113) samples. Pixel positivity was assessed with QuPath's Pixel Classification tool. (c) Kaplan–Meier estimates of DFS in BlCa patients stratified by PD‐L1 expression; (d) Stratified Kaplan–Meier analyses of DFS and DSS according to PD‐L1 expression and ‘HG NMIBC vs MIBC’ classification. (a) Comparison between ‘HG NMIBC Low’ and ‘HG NMIBC High’; (b) Comparison between ‘MIBC Low’ and ‘MIBC High’. Dichotomisation into low and high expression was based on the median value. (e) Distribution of FoxP3+ICOS+ cells density based on PD‐L1‐positive percentage. P‐values calculated by the non‐parametric Mann–Whitney U‐test are depicted in b and e; only significant associations (P < 0.05) are denoted for simplification purposes ‐ *P < 0.05, **P < 0.01, ***P < 0.001, ****P < 0.0001. P‐values denoted in c and d were calculated by the log‐rank test. HG NMIBC, high‐grade non‐muscle invasive bladder cancer; MIBC, muscle‐invasive bladder cancer.
