Figure 7.
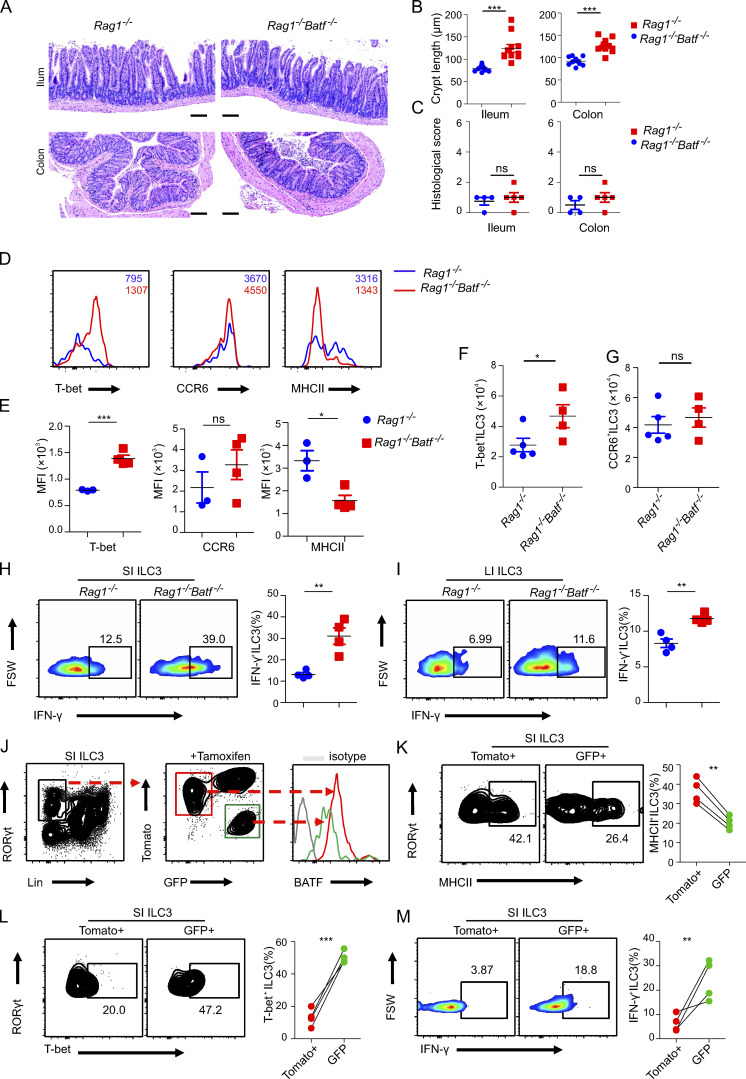
BATF acts on ILC3s in a cell-intrinsic manner. (A) Representative H&E staining of ileum and colon of Rag1−/− and littermate control Rag1−/−Batf−/− mice. Scale bar, 100 µm. (B) Quantification of crypt length of ileum and colon as in A. (C) Quantification of the histological score of ileum and colon as assessed in A. (D) Representative histogram flow plot of SI ILC3s (Lin−CD90.2+RORγt+) of Rag1−/− and littermate control Rag1−/−Batf−/− mice. (E) Quantification of MFI of indicated markers on or in SI ILC3s from Rag1−/− and littermate control Rag1−/−Batf−/− mice. (F and G) Quantification of cell number of T-bet+ ILC3 (F) and CCR6+ ILC3 (G) in SI from Rag1−/− and littermate control Rag1−/−Batf−/− mice. (H and I) Representative flow plots and quantification of intracellular staining of ILC3s isolated from SI (H) and LI (I) after stimulation with PMA plus ionomycin ex vivo. ILC3s were isolated from Rag1−/− and littermate control Rag1−/−Batf−/− mice. (J) Gating strategy of flow cytometry analysis of SI ILC3s from Batffl/fl ERT2CreRosamTmG mice treated with TAM (left) and intrinsic differences of BATF expression between Tomato+ WT (red) and GFP+ BATF-deficient (green) ILC3s. (K) Representative flow plot (left) and quantified frequency (right) of MHCII+ ILC3s gated on Lin−RORγt+Tomato+ and Lin−RORγt+GFP+ cells. (L) Representative flow plot (left) and quantified frequency (right) of T-bet+ ILC3s gated on Lin−RORγt+Tomato+ and Lin−RORγt+GFP+ cells. (M) Representative flow plot (left) and quantified frequency (right) of IFN-γ+ ILC3s gated on Lin−RORγt+Tomato+ and Lin−RORγt+GFP+ cells. ILC3s were isolated from SI and stimulated with PMA plus ionomycin ex vivo. For B–C and E–G, data are shown as mean ± SEM. *P < 0.05, **P < 0.01, ***P < 0.001 (two-tailed unpaired t test). Each dot represents one mouse, n = 3−4 mice per group. Data are representative of at least two independent experiments. For K–M, connected dots indicate one individual mouse (n = 4). Statistical differences were tested using a paired t test (two-tailed). *P < 0.05, **P < 0.01, ***P < 0.001. Data are representative of two independent experiments.

