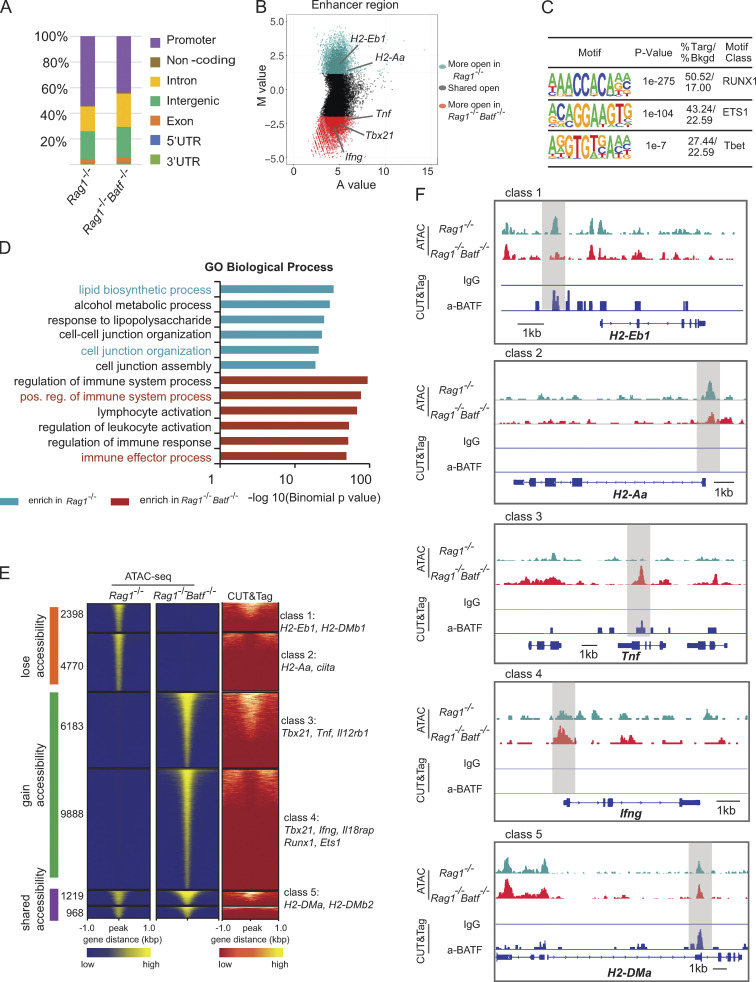
Figure 8.
BATF maintains the chromatin landscape of ILC3s. (A) Distribution of ATAC-seq peaks across the genome in Rag1−/− and Rag1−/−Batf−/− SI ILC3s. (B) Scatter plot (MA plot) showing M value (log2[read density in Rag1−/− ÷ read density in Rag1−/−Batf−/−]) vs. A value (0.5 × log2[read density in Rag1−/− × read density in Rag1−/−Batf−/−]) of the merged set of Rag1−/− and Rag1−/−Batf−/− enhancer ATAC-seq peaks after normalization. The top 5,000 peaks are highlighted for Rag1−/− (dark green) and Rag1−/−Batf−/− (dark red) ILC3s. Selected genes are labeled. (C) Selected Th1-associated TF binding motifs significantly enriched in the top 5,000 specific enhancers of Rag1−/−Batf−/− ILC3s. (D) GO pathway analysis of genes with differential chromatin accessibility between Rag1−/− (dark green) and Rag1−/−Batf−/− (dark red) was performed using GREAT. The −log10(binomial P value) is shown for the top six Molecular Signature Database pathways enriched in Rag1−/− and Rag1−/−Batf−/−-specific enhancers, with pathways of interest highlighted based on sample enrichment. (E) Heatmap of all atlas peaks of ATAC-seq of enhancers in Rag1−/− and Rag1−/−Batf−/− ILC3s, including peaks that gain and lose accessibility between Rag1−/− and Rag1−/−Batf−/− ILC3s and those in common between the two (left and middle panels). The right panel shows a heatmap of BATF binding peaks corresponding to atlas peaks in the left and middle panels. Combinatorial peak distribution patterns generated distinct six major classes of locus accessibility and binding. Representative annotation of nearby genes for class 1–5 is shown. (F) Genomic snapshots showing accessibility (ATAC-seq) in Rag1−/− and Rag1−/−Batf−/− ILC3s as well as anti-BATF and control IgG (CUT&Tag) binding in Rag1−/− ILC3s. Representative loci of class 1–5 are shown.

