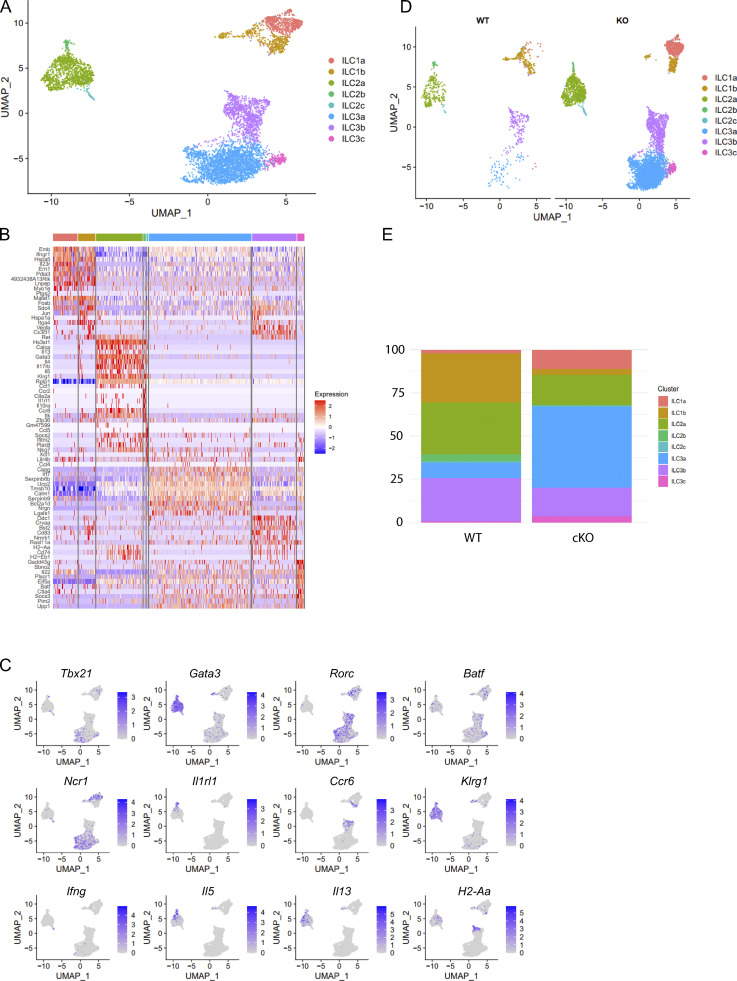
Figure S4.
BATF deficiency alters heterogeneity of SI ILCs. Related to Fig. 3. (A) UMAP plot of scRNA-seq data of SI-derived ILCs from cKO and littermate control WT mice. Cells are colored by cluster. (B) Heatmap reporting scaled expression of genes differentially upregulated by each cluster. (C) Expression of select marker genes as visualized by UMAP plots. (D) UMAP plot split by sample of origin. Cells are colored by cluster. (E) Stacked bar plots displaying the proportion of clusters in WT and cKO mice as shown in D.

