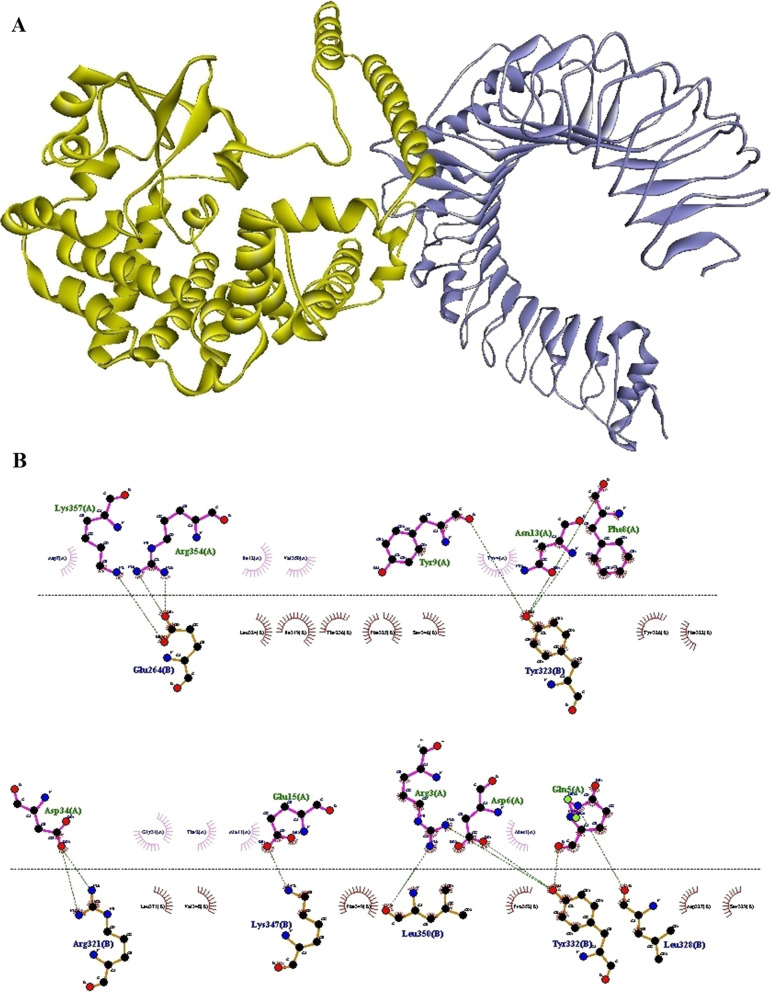
Fig. 2.
Docking output of the N-PepO and TLR2 receptor. A The 3D structure shows the interaction between TLR2 and PepO as the receptor and ligand represented in harbor blue and yellow, respectively. B The formation of hydrogen bonds between the Glu264, Arg321, Tyr323, Leu328, Tyr332, Lys347, and Leu350 of TLR2 and the Arg3, Gln5, Asp6, Phe8, Tyr9, Asn13, Glu15, Asp34, Arg354, and Lys357 residues of PepO is shown by Dimplot 2D-interaction plot. TLR2 residues, PepO residues, hydrogen bonds, and non-bonded residues are presented in blue, green, green dashed lines, and red/pink eyelashes, respectively

