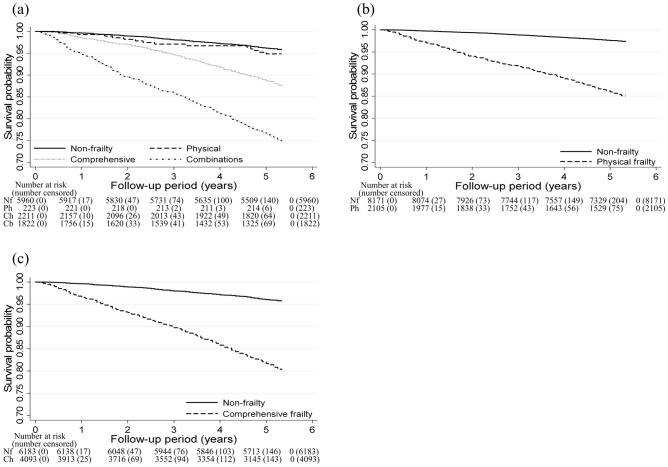
Figure 2.
Multivariate adjusted Kaplan–Meier survival curves using inverse probability weighting for all-cause mortality according to frailty status among older adults. (a) Four groups stratified by frailty screening index (FSI) and Kihon Checklist (KCL); (b) two groups stratified by FSI; (c) two groups stratified by KCL. Nf, non-frailty; Ph, physical frailty; Ch, comprehensive frailty; Cb, combinations. The adjustment factors are age, sex, population density, family structure, economic status, educational attainment, smoking status, alcohol consumption status, sleep time, medication use, and number of chronic diseases.

