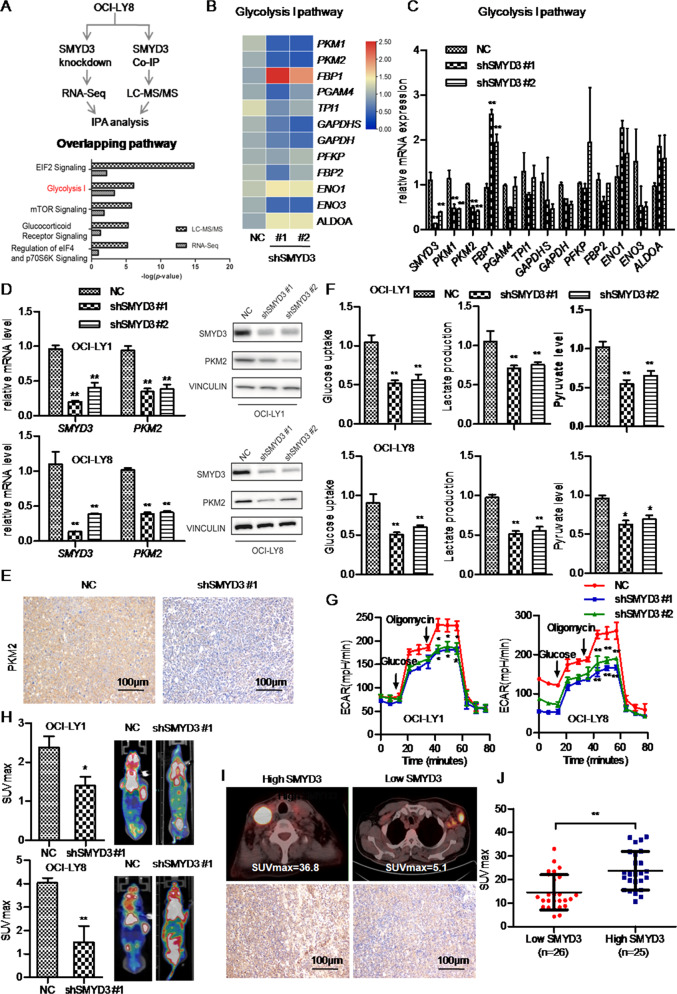
Fig. 3. SMYD3 promotes PKM2 expression and aerobic glycolysis in DLBCL cell lines in vitro and in vivo.
A Flowchart of IPA analysis and the top 5 significant pathways of DEGs in integrated analysis of LC-MS/MS and RNA-Seq data. B, C The mRNA levels of DEGs enriched in ‘glycolysis’ were validated using reverse transcription-quantitative PCR in SMYD3-knockdown OCI-LY8 cells and NC cells and were visualized in the heatmap. (The names of the different columns in the heatmap were shown). D The mRNA and protein expression of PKM2 decreased following SMYD3knockdown in the OCI-LY1 and OCI-LY8 cell lines. E SMYD3 and PKM2 staining in xenograft tissue samples from mice injected with SMYD3-knockdown OCI-LY8 and NC cells. Magnification, x200. Scale bar,100 μm. F Glucose uptake, cellular pyruvate levels, lactate production and G ECAR significantly decreased following SMYD3 knockdown in the OCI-LY1 and OCI-LY8 cell lines. H SMYD3 knockdown inhibited the glucose uptake of DLBCLs in vivo. I Illustration of SUVmax from PET-CT scans of patients with DLBCL and high or low SMYD3 protein expression. J High SMYD3 protein expression was significantly associated with the SUVmax of patients with DLBCL. *P < 0.05, **P < 0.01, ***P < 0.001. DLBCL Diffuse large B-cell lymphoma, SMYD3 SET and MYND domain containing 3, PKM2 Pyruvate kinase M2, DEG Differentially expressed gene, IPA Ingenuity pathway analysis, LC Liquid chromatography, MS Mass spectrometry, RNA-Seq RNA sequencing, NC Negative control, PET Positron emission tomography, CT Computed tomography, ECAR Extracellular acidification rate, SUVmax Maximum standardized uptake value.

