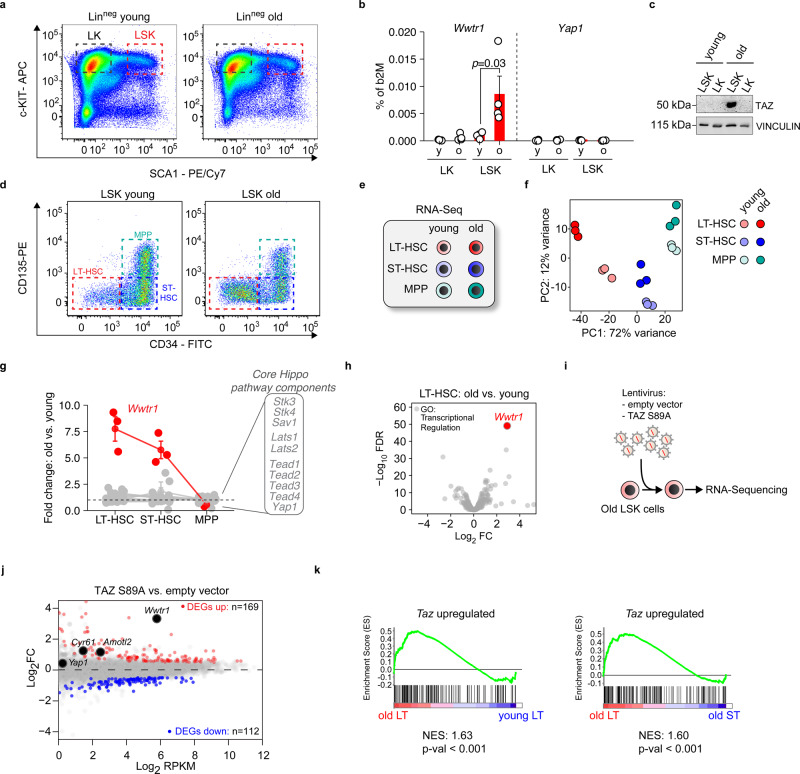
Fig. 1. TAZ (Wwtr1) is strongly induced in oLT-HSCs.
a Representative flow cytometry plots of LK (Lineageneg, Sca-1neg, c-Kitpos) and LSK (Lineageneg, Sca-1pos, c-Kitpos) cells of young and old mice. b qRT-PCRs of Wwtr1 and Yap1 expression in LK and LSK isolated from young and old mice (n = 4 per age group, one-way ANOVA with Tukey HSD post hoc test). c Immunoblot analysis of TAZ in LK and LSK of young and old mice. d Representative flow cytometry plots of LT-HSCs, ST-HSCs, and MPP in the LSK compartment of young and old mice. e Overview of the samples that were analyzed by RNA-Seq (n = 3 per group). f Principal component analysis of the RNA-Seq of the indicated populations (n = 3 per group). g Summary of gene expression changes (old vs. young) of Hippo pathway core components. h Volcano plot encompassing all transcriptional regulators (KEGG database) that were analyzed in the LT-HSC dataset old vs. young. FDR = false discovery rate; FC = fold change. I Experimental strategy to identify TAZ-induced genes in oLSK. j MA plot of the TAZ S89A overexpression RNA-Seq (n = 3 per condition). Significantly up- and downregulated genes (FDR < 0.01) are colored in red and blue, respectively. DEG = differentially expressed genes. k Gene set enrichment analysis for the given comparisons applying a TAZ-induced set of 169 genes. NES = normalized enrichment score. Data in b, g are presented as mean values +/− SEM. Source data are provided as a Source data file.

