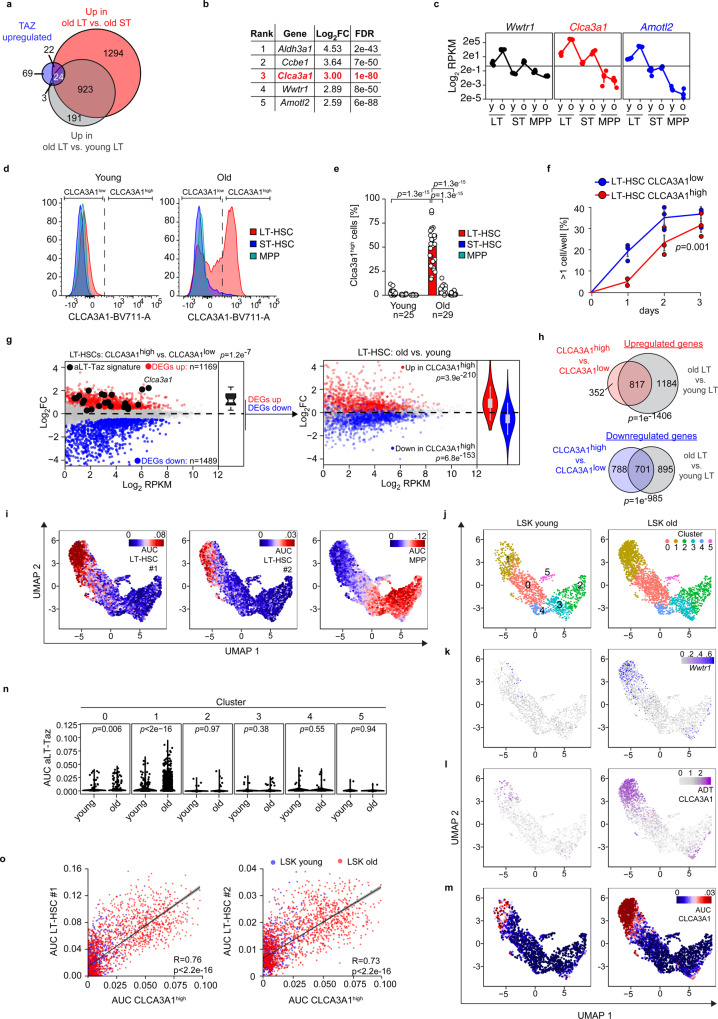
Fig. 2. Clca3a1 is induced by TAZ and marks oLT-HSCs.
a Overlap among upregulated genes of the indicated RNA-Seq datasets (Log2FC > 0.5, FDR < 0.01). b Top TAZ-induced LT-HSC-specific genes sorted according to their regulation in old vs. young LT-HSCs. c RPKM values (Log2 scale) of Wwtr1, the TAZ target gene Amotl2 and Clca3a1 determined by RNA-Seq (n = 3 per age group and population). d Representative flow cytometry plots for CLCA31 expression in the given populations from young and old mice. e Quantification of samples analyzed in d (n = 25 for young, n = 29 for old mice). f Single cell colony-forming assay of isolated CLCA3A1low and CLCA3A1high LT-HSCs. Single cells were seeded and the time to completion of the first cell division was measured (n = 3 per group, one-way ANOVA with Tukey HSD post hoc test). g Left panel: MA plot of an RNA-Seq comparing CLCA3A1high vs. CLCA3A1low LT-HSCs (n = 3 per group, LSK CD34neg CD135neg). Significantly up- and downregulated genes (FDR < 0.01) are colored in red and blue, respectively. Right panel: Significantly regulated genes of the CLCA3A1high vs. CLCA3A1low RNA-Seq were colored in the RNA-Seq comparing old vs. young LT-HSCs. Boxplot: bottom/top of box: 25th/75th percentile; upper whisker: min(max(x), Q_3 + 1.5 * IQR), lower whisker: max(min(x), Q_1−1.5 * IQR), center: median. h Venn diagram of significantly regulated genes in the given RNA-Seq datasets. The p-values for a significant overlap were determined by a hypergeometric test. i UMAP dimensionality reduction plots for CITE-Seq data of young and old LSKs. The activity of the indicated gene sets (LT-HSC#1, LT-HSC#2, and MPP) is color-coded based on their AUC. AUC = area under the curve. j–m UMAP plots for CITE-Seq data of young (left) and old (right) LSKs, respectively. Graph-based clusters (j), Wwtr1 mRNA expression (k), CLCA3A1 protein based on ADTs (l), and CLCA3A1high gene set activity based on AUCs (m) are depicted. n Violin plots of TAZ gene set activity (AUC scores) in the different clusters of young and old LSKs, respectively. Cluster 1 contains HSC-like cells, see also (i) (two-sided Wilcox test). o Scatter plots of CLCA3A1high gene set activity plotted against the activity of two different LT-HSC gene sets #1 and #2, respectively (R = Pearson correlation coefficient, linear regression t-test). Data in c, f are presented as mean values +/− SEM. Source data are provided as a Source data file.

