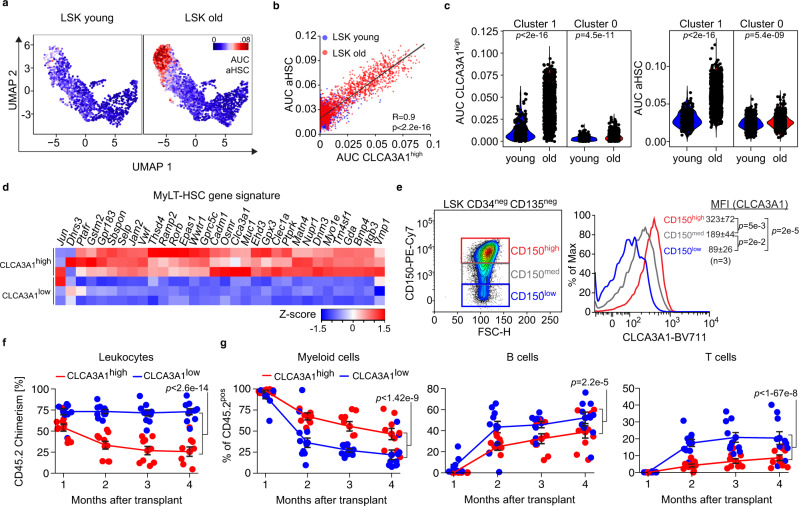
Fig. 3. CLCA3A1high HSCs demonstrate features of aged HSCs.
a UMAP plots for CITE-Seq data of young and old LSKs. The activity of the aged HSC (aHSC) signature is colored based on the gene set activity. b Scatter plots of CLCA3A1high gene set activity plotted against the activity of an HSC aging signature from the CITE-Seq dataset (R = Pearson correlation coefficient, linear regression t-test). c Violin plots of CLCA3A1high (left) and aHSC (right) gene set activity in clusters 0 and 1 from the CITE-Seq (two-sided Wilcox test). d Heatmap of Z-score normalized expression values for a gene set for myeloid-biased LT-HSCs (MyLT-HSCs) (n = 3 per group). e Representative flow cytometry plots for CD150 and CLCA3A1 of oHSCs. The CD150 signal was divided into three different windows (left) and the CLCA3A1 signal was plotted for each window (right). The numbers give the mean fluorescence intensity (MFI) ± 95% confidence interval (one-way ANOVA with Tukey HSD post hoc test). f Leukocyte chimerism in the PB over time after competitive transplantation of CLCA3A1high or CLCA3A1low LT-HSCs (n = 10 for CLCA3A1low, n = 9 for CLCA3A1high, two independent transplantations, two-way ANOVA with Tukey HSD post hoc test). g Percentage of myeloid (CD11bpos), B (B220pos) and T cells (CD4pos or CD8pos) from the donor (CD45.2pos) after competitive transplantation of CLCA3A1high or CLCA3A1low LT-HSCs (n = 10 for CLCA3A1low, n = 9 for CLCA3A1high, two independent transplantations, two-way ANOVA with Tukey HSD post hoc test). Data in f, g are presented as mean values +/− SEM. Source data are provided as a Source data file.

