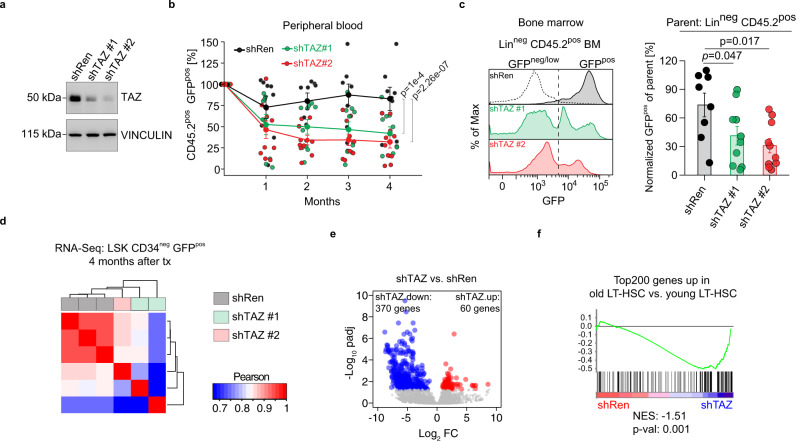
Fig. 4. CLCA3A1high HSCs depend on high TAZ expression.
a Immunoblot of NIH3T3 cells infected with the indicated shRNAs. An shRNA targeting Renilla (shRen) serves as control. The experiment was independently repeated three times. b PB analysis after transplantation of CLCA3A1high HSCs transduced with the indicated shRNAs. The GFPpos population in the donor CD45.2pos compartment was analyzed for 4 months post-transplantation (shRen: n = 8, shTAZ#1: n = 10, shTAZ#2: n = 10, three independent transplantations, two-way ANOVA with Tukey HSD post hoc test). c Representative GFP flow cytometry plots of Linneg CD45.2pos BM cells 4 months after transplantation (left). The dotted line indicates the negative control for GFP (gated on CD45.1/2pos supporting cells). Right panel: percentage of GFPpos cells in Linneg BM cells. The cells were gated on Linneg CD45.2pos donor cells (shRen: n = 8, shTAZ#1: n = 10, shTAZ#2: n = 10, three independent transplantations, one-way ANOVA with post hoc paired Wilcox test and Benjamini-Hochberg correction). d Correlation analysis of RNA-Seq data from LSK CD34neg cells. Old CLCA3A1high HSCs were transduced with the indicated constructs and transplanted. RNA-Seq was performed 4 months after transplantation. e Volcano plot of LSK CD34neg cells from (d). padj = adjusted p-value, FC = fold change. f GSEA analysis of shTAZ vs. shRen transduced HSCs using a gene set consisting of the Top200 upregulated genes in old vs. young LT-HSCs. Data in b, c are presented as mean values +/− SEM. Source data are provided as a Source data file.

