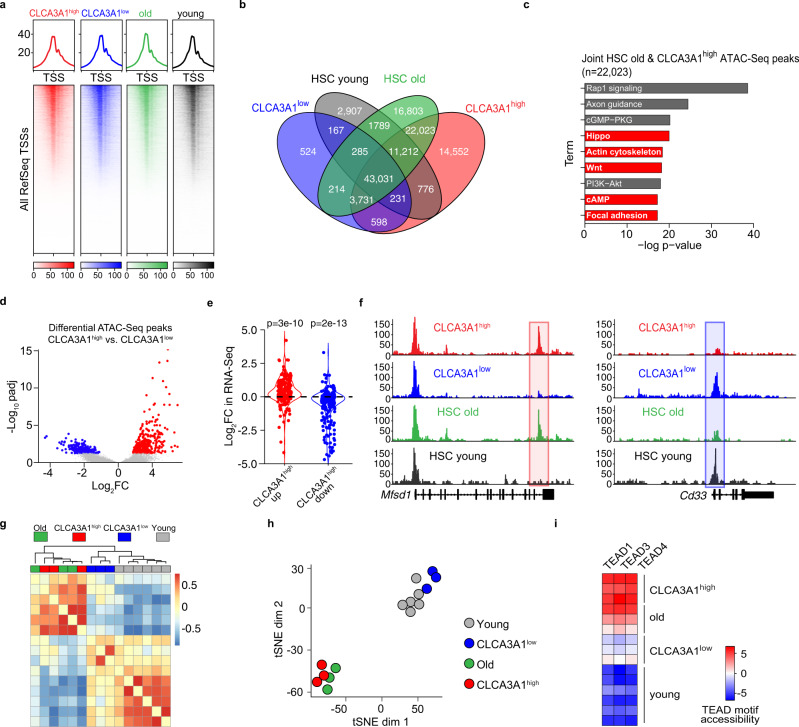
Fig. 5. CLCA3A1low HSCs resemble yHSCs on chromatin level.
a Heatmaps for FAST-ATAC data of CLCA3A1high, CLCA3A1low LT-HSCs, oHSCs and yHSCs (n = 3 for CLCA3A1low, CLCA3A1high and HSC old; n = 6 for HSC young). All transcriptional start sites (TSSs) were included and sorted according to the strongest signal. b Venn diagram of FAST-ATAC peaks. c Gene ontology analysis of FAST-ATAC peaks and their associated genes that are unique to oHSCs and CLCA3A1high. The top 10 pathways are depicted. d Volcano plot for differential FAST-ATAC peaks comparing Clca3a1high vs. Clca3a1low LT-HSCs. padj = adjusted p-value, FC = fold change. e Violin plots for the regulation in the RNA-seq dataset of genes that are associated with a differentially accessible FAST-ATAC peak (<25 kb distance from the TSS). Either peaks were used that are significantly more (CLCA3A1high up, red) or less (CLCA3A1high down, blue) accessible in CLCA3A1high vs. CLCA3A1low LT-HSCs (two-sided Wilcox test). f Representative genome tracks of the FAST-ATAC experiments of a CLCA3A1high up peak (red box) and a CLCA3A1high down peak (blue box). g Clustering of TF motif. accessibility for all motifs in the different samples (n = 3 per group). h tSNE plot of TF motif accessibility for all motifs in the different samples. i TEAD motif accessibility in all peaks of the given samples. Source data are provided as a Source data file.

