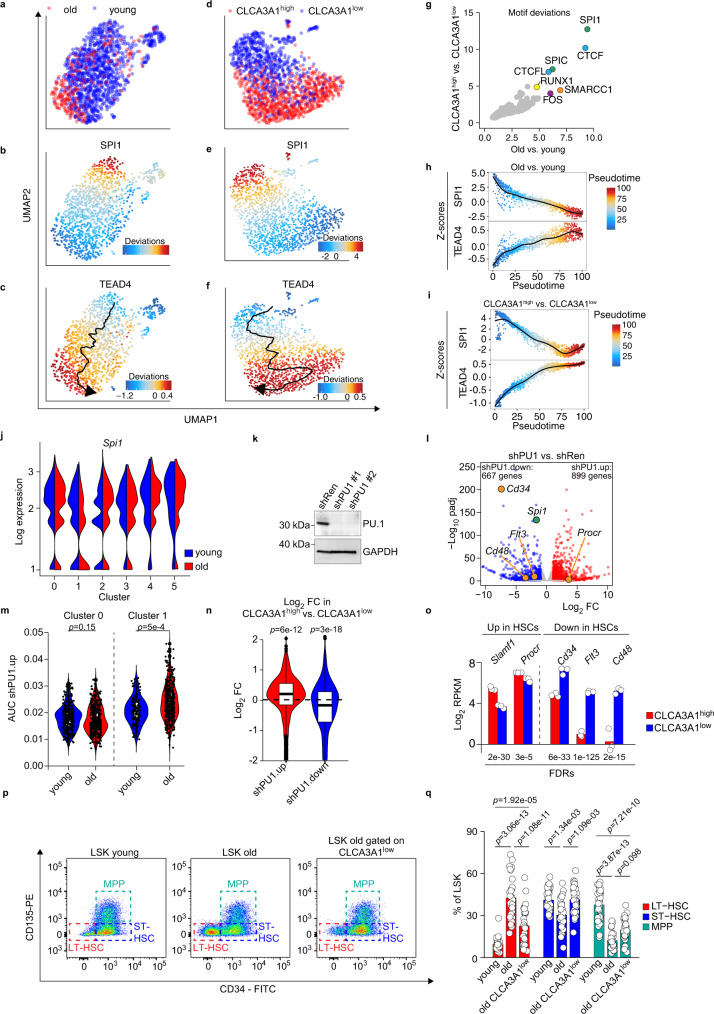
Fig. 6. Aging leads to decreased PU.1 activity in CLCA3A1high HSCs.
a–f UMAP plots for scATAC experiments from old vs. young HSCs (a–c) and Clca3a1high vs. Clca3a1low HSCs (d, e). Motif accessibility of SPI1 and TEAD4 is color-coded. The pseudotime trajectory is included in c, f, respectively. g Scatter plot that shows the most variable motifs in the given comparisons. h, i Scatter plot showing the SPI1 and TEAD4 motif accessibility (as Z-score) of individual cells within the pseudotime trajectory for the indicated comparisons. j Expression of Spi1 in the different clusters of the CITE-Seq dataset. k Immunoblot for PU.1 in BM-HPC#5 after infection with the indicated shRNAs. Gapdh serves as loading control (experiment repeated once with similar results). The experiment was independently repeated three times. l Volcano plot for gene expression changes after PU.1 depletion (shPU1#1 and shPU1#2) in BM-HPC#5 cells. DEGs (padj < 0.05, log2FC > 1 or log2FC < (−1), respectively) are colored in blue and red. padj = adjusted p-value. m Violin plots for the shPU1.up gene set activity in the indicated clusters from the scRNA-Seq dataset of young and old LSK cells (two-sided Wilcox test). n Violin plots for the shPU1.up gene set (n = 899 genes) and the shPU1.down gene set (n = 667 genes) comparing the expression in CLCA3A1high vs. CLCA3A1low LT-HSCs (two-sided Wilcox test). o Log2 RPKM values of the indicated genes coding for HSC surface markers in CLCA3A1high and CLCA3A1low LT-HSCs, respectively. Data from RNA-Seq comparing CLCA3A1high vs. CLCA3A1low LT-HSCs (n = 3 per group, LSK CD34neg CD135neg). p Representative flow cytometry plots from young and old LSK cells, respectively. In the right panel (LSK old gated on CLCA3A1low), the oLSK cells were additionally gated on low CLCA3A1 staining intensity. q Barplots summarizing the analysis outlined in p (n = 33 for young, n = 30 for old mice, one-way ANOVA with Tukey HSD post hoc test). Boxplots in m, n: bottom/top of box: 25th/75th percentile; upper whisker: min(max(x), Q_3 + 1.5 * IQR), lower whisker: max(min(x), Q_1−1.5 * IQR), center: median. Source data are provided as a Source data file.

