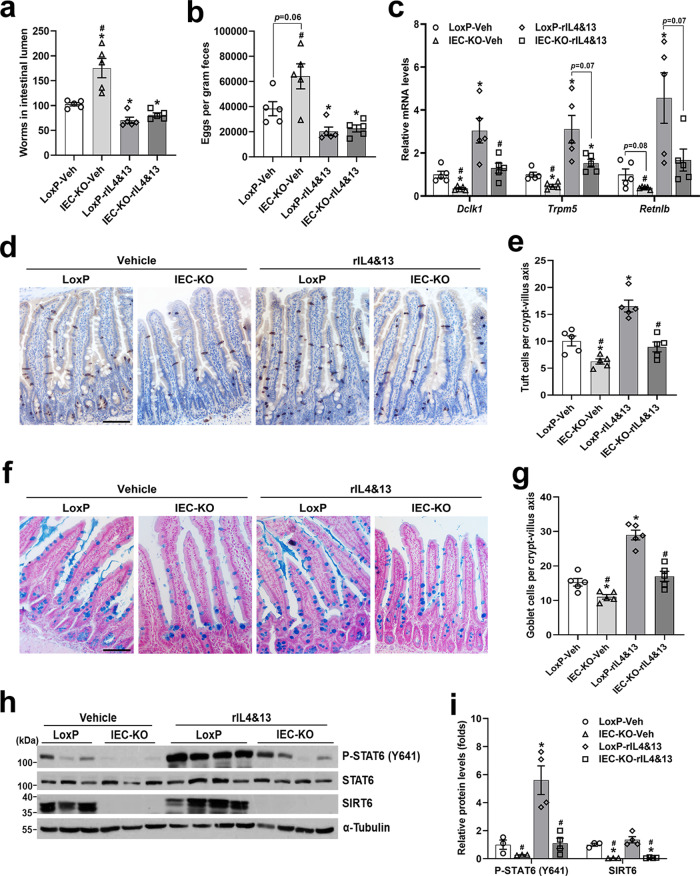
Fig. 2. Recombinant IL4&IL13 treatment fails to rescue the impaired tuft and goblet cell hyperplasia caused by epithelial Sirt6 ablation.
3-4-month-old male LoxP and IEC-KO mice were injected (i.p.) daily with vehicle or rIL4&rIL13 (1ug/mouse) from day 6 after H. poly infection and subjected to the following analyses on day 14 post-infection. a, b Analysis of parasite burden by quantification of adult worms in intestinal lumen (a) and eggs in feces (b). n = 5 mice/group; form left to right, *p = 0.019, 0.0038, 0.0038; #p = 0.004 in (a); *p = 0.03, 0.0466; #p = 0.0092 in (b). c qPCR analysis of tuft and goblet cell markers expression in the jejunal IECs. n = 5 mice/group; form left to right, Dclk1 (*p = 0.0125, 0.021; #p = 0.0092, 0.0348), Trpm5 (*p = 0.0058, 0.0288, 0.0422; #p = 0.0144), Retnlb (*p = 0.0368; #p = 0.0235). d Jejunal tuft cells were examined by IHC staining with anti-DCLK1 antibody (200X). e Quantification of tuft (DCLK1 positive) cells shown in (d). n = 5 mice/group; 20 crypt-villus units counted for each mouse; from left to right, *p = 0.0104, 0.0021; #p = 0.0002, 0.0008. f Jejunal goblet cells were examined by Alcian blue staining (200X). g Quantification of goblet (Alcian blue positive) cells shown in (f). n = 5 mice/group; 20 crypt-villus units counted for each mouse; from left to right, *p = 0.0149, <0.0001; #p < 0.0001, 0.0003. h, i Western blot (h) and quantification (i) analyses of P-STAT6 (Y641) and SIRT6 in the jejunal IECs. n = 3, 3, 4, 4 mice/group, respectively; from left to right, P-STAT6 (*p = 0.0159; #p = 0.0136, 0.0161), SIRT6 (*p = 0.0118, 0.0113; #p = 0.0099, 0.0102). Data are presented as mean ± SEM. All p values were generated by two-tailed unpaired t test. *p < 0.05 vs LoxP-Veh, #p < 0.05 vs LoxP-rIL4&13. Scale bars, 100 µm. Source data are provided as a Source Data file.

