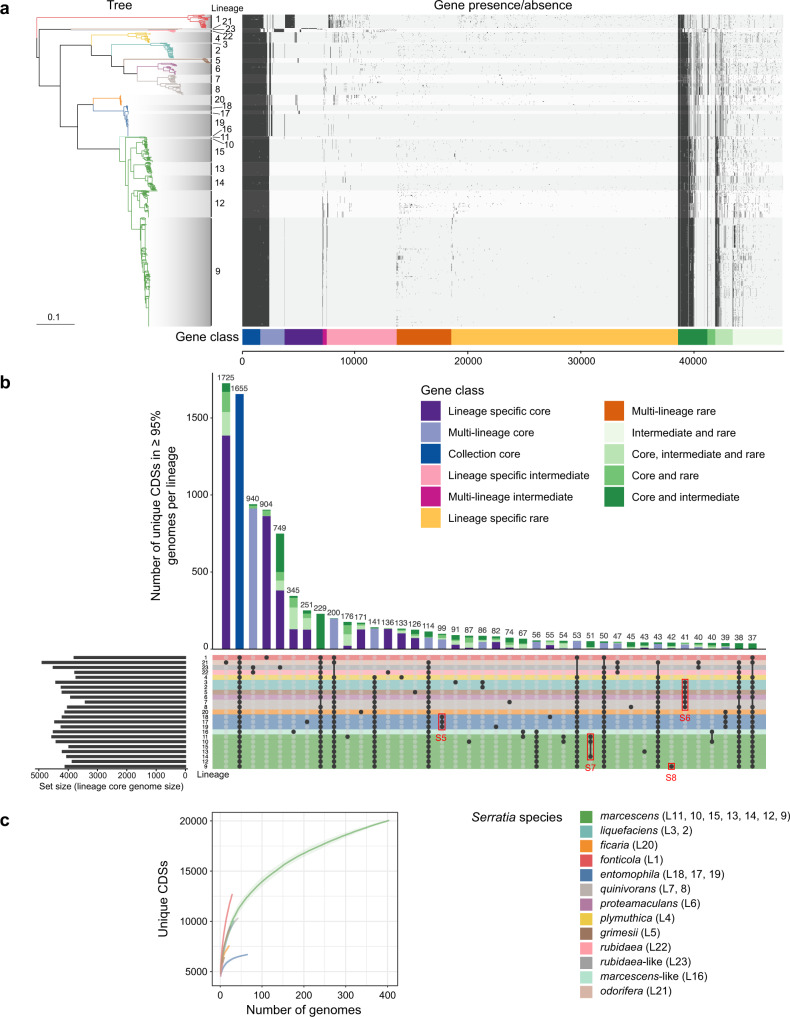
Fig. 2. The pan-genome of Serratia.
a Presence/absence matrix of the 47,743 genes in the Serratia pan-genome, generated using Panaroo and overlaid with shading according to lineage, alongside the maximum-likelihood tree in Fig. 1. The presence/absence matrix is ordered by gene class as defined by Twilight. Gene class is first defined within each lineage by calculating whether genes are core (in ≥95% of strains in each lineage), intermediate (in >15% and ≤95% of strains), or rare (in ≤15% of strains). Classification of each gene group per lineage is then compared between lineages. Gene groups core to all lineages are collection core, gene groups core to only certain lineages are multi-lineage core, and genes core to only a single lineage are lineage-specific core. Individual genes found at intermediate or rare occurrence in all, multiple, or single lineages are classified similarly, as intermediate or rare genes. These three classes are indicated by colour: core, blue shades; intermediate, pink shades; and rare, orange shades. Genes which are in one classification (core, intermediate, rare) in a particular lineage but in another classification in a separate lineage are termed hybrid classes (green shades). b UpSetR plot showing the 40 largest intersections of lineage-specific core genomes (genes present in ≥95% of strains in each lineage). Lineages with membership to each intersection are shown by the presence of a black dot in the presence/absence matrix underneath the stacked bar plot. Stacked bar plots representing the number of genes in each intersection are coloured according to the gene classes assigned by Twilight, where singleton lineages (here L22 and L23) have been included. Rows in the presence/absence matrix correspond to each lineage and are coloured according to Serratia species defined by fastANI. Red boxes indicate intersections of genes represented in Supplementary Figs. 5–8. c Estimated pan-genome accumulation curves for each Serratia phylogroup. Shaded region represents standard deviation. Throughout, species are coloured according to the key in c. Source data are provided as a Source Data file.

