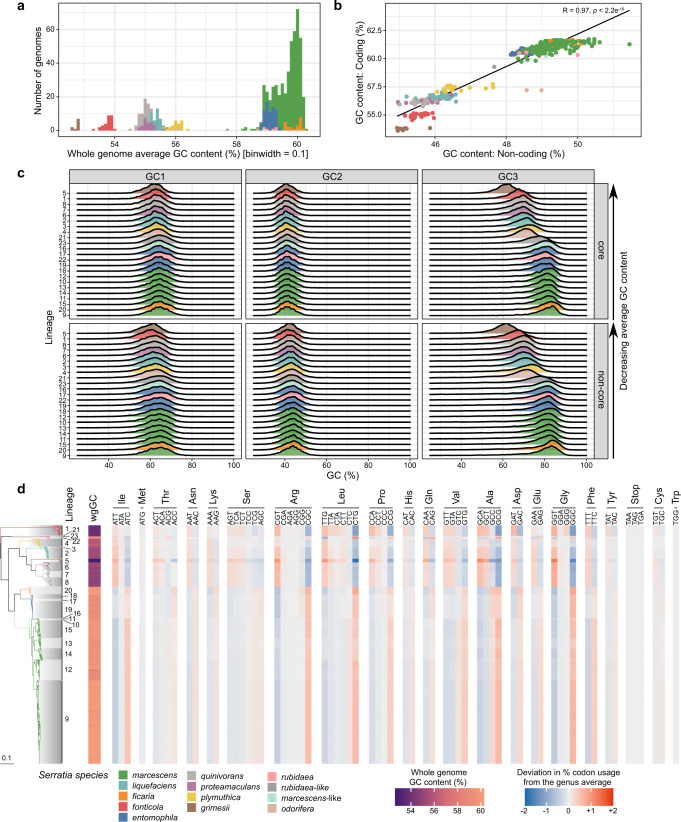
Fig. 4. Serratia is split by GC content.
a Histogram of GC content (average over whole genome) across Serratia. b Plot of GC content of coding regions against that of intergenic (non-coding) regions for each genome; a Pearson correlation test (two-sided) was performed, giving correlation coefficient R 0.97 and p value < 2.2e−16 (n = 664). c Distribution of GC content in codon positions 1, 2, and 3 in all genus-core (core) and non-genus-core (non-core) genes across each lineage. Data is normalised according to gene length. Ridgeplots are coloured according to Serratia species/phylogroup. Lineages are ordered from top to bottom according to average GC content across the whole genome. d Codon usage (CU) within the genus-core genome. Blue to red colour represents deviation from the average CU across the entire genus for each codon, with this genus-average CU calculated from a per-lineage mean CU value to account for the different numbers of sequences in each lineage. The whole genome GC (wgGC) content is also shown in the left-most column. Source data are provided as a Source Data file.

