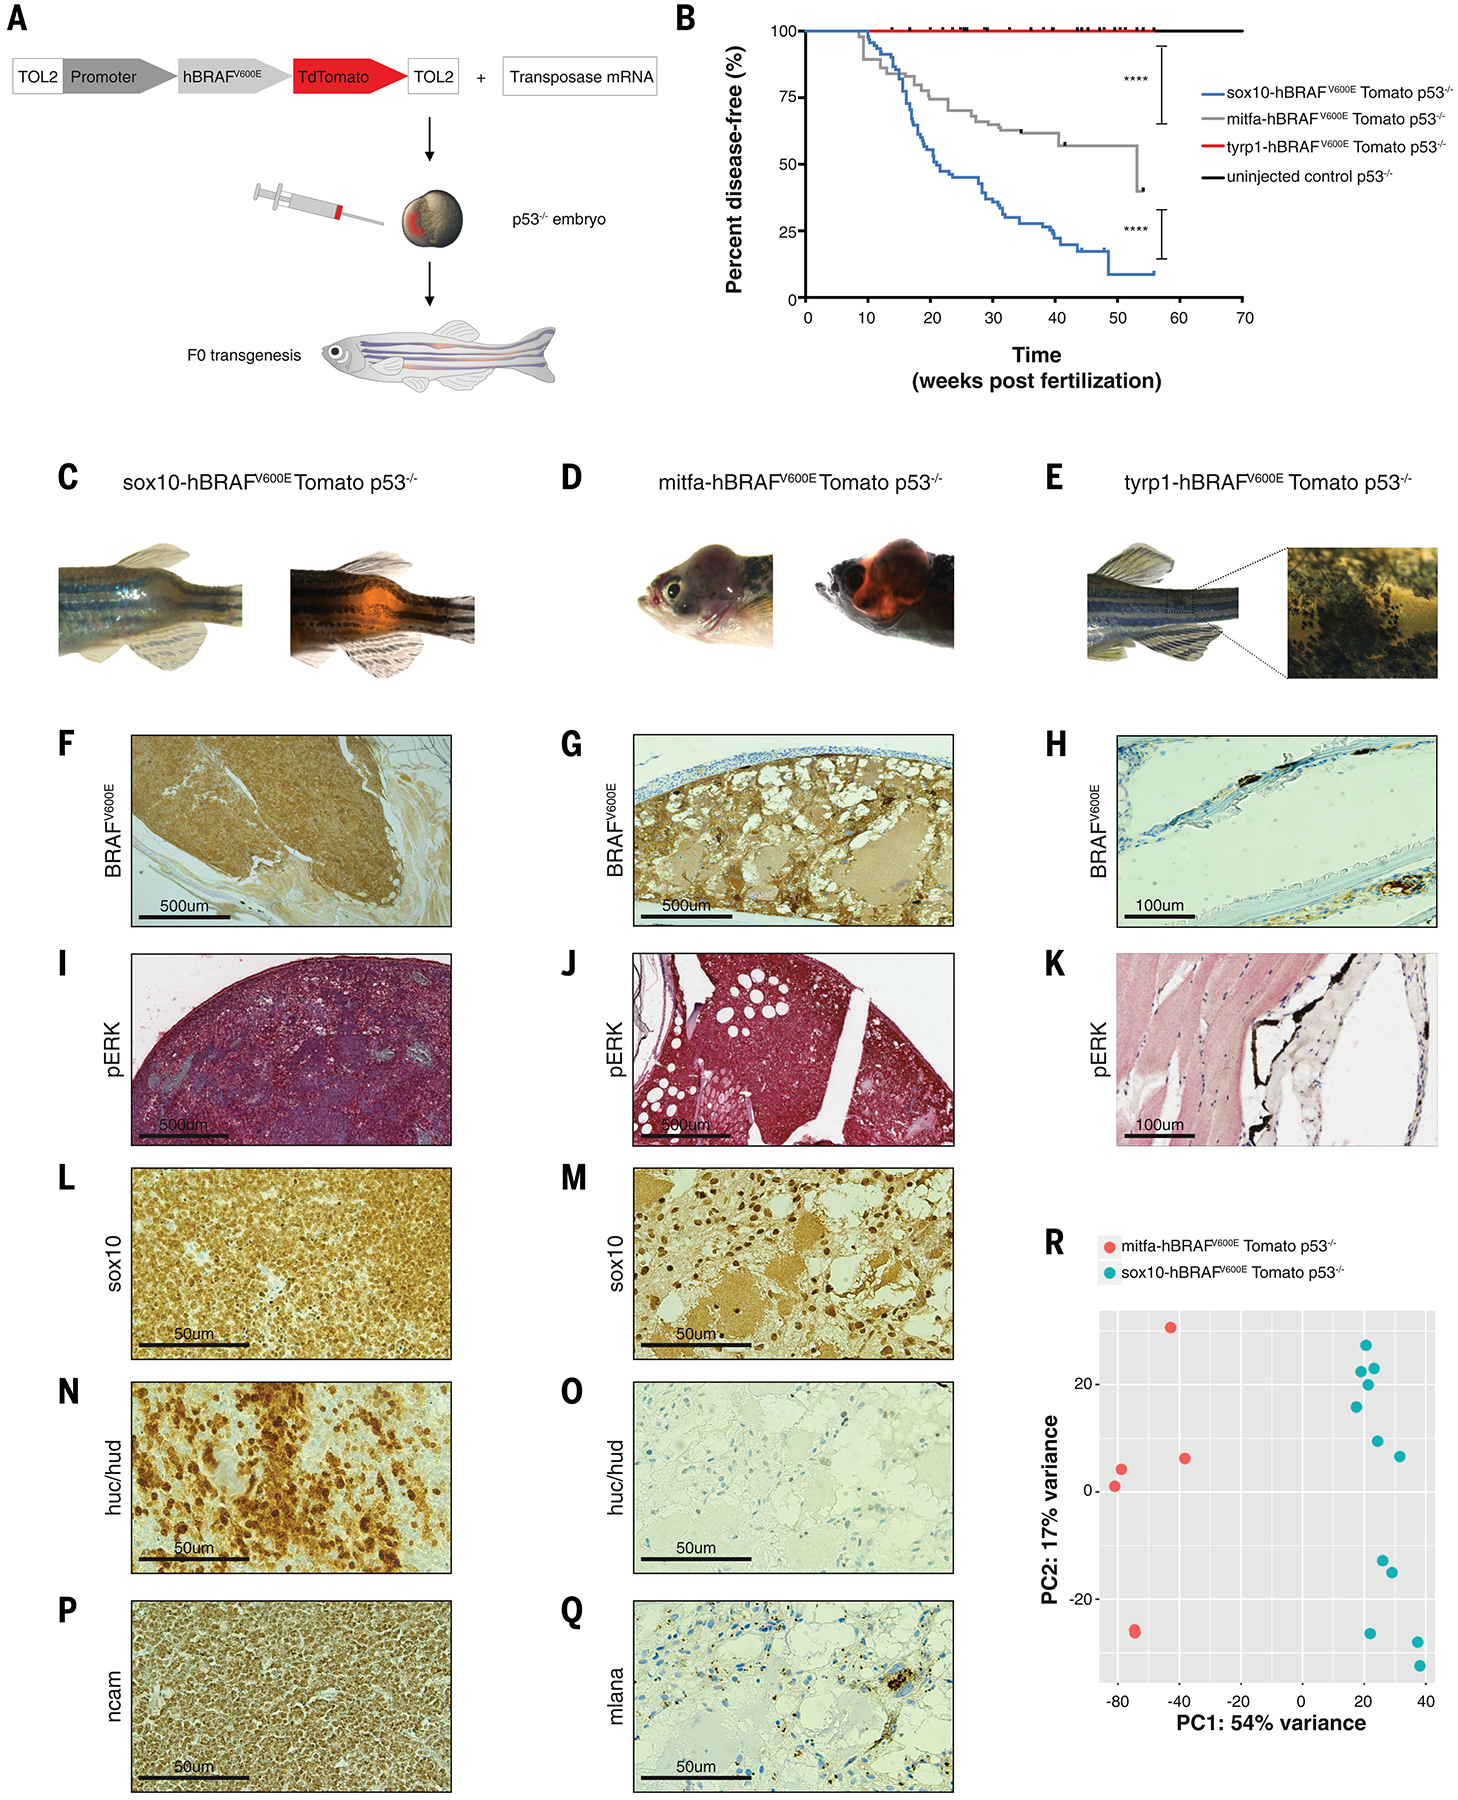
Fig. 1. Zebrafish models show that neural crest cells and melanoblasts, but not melanocytes, are cancer competent.

(A) Schematic drawing of zebrafish F0 transgenesis. F0 zebrafish transgenic fish were engineered by injection of p53−/− single-cell embryos with transposase mRNA together with TOL2 flanked plasmids, which encoded a stage-specific promoter (sox10, mitfa, tyrp1) driving BRAFV600E fused to TdTomato.
(B) Kaplan-Meier curves of F0 p53−/− transgenic zebrafish injected with plasmids driving BRAFV600E fused to TdTomato under either the neural crest-specific promoter sox10 (n=92 biological replicates), the melanoblast-specific promoter mitfa (n=94 biological replicates), or the melanocyte-specific promoter tyrp1 (n=49 biological replicates) or uninjected control (n=86 biological replicates). **** = p < 0.0001 for the comparison of the tumor-free survival curves of fish with melanoblast-derived tumors and melanocyte-derived nevus-like structures; **** = p < 0.0001 for the comparison of the tumor-free survival curves of fish with neural crest- and melanoblast-derived tumors; log-rank (Mantel-Cox) test.
(C) Neural crest-derived tumor developed in the sox10-BRAFV600E p53−/− transgenic fish.
(D) Melanoblast-derived tumor developed in the mitfa-BRAFV600E p53−/− transgenic fish.
(E) Nevus-like structure developed in the tyrp1-BRAFV600E p53−/− transgenic fish.
(F−K) Immunohistochemistry for BRAFV600E and phospho ERK in the neural crest- and melanoblast-derived tumors and in the melanocyte-derived nevus-like structure.
(L−Q) Immunohistochemistry staining for sox10, huc/hud, ncam and mlana. Neural crest derived tumors were positive for the neuronal marks huc/hud and ncam (N, P) and weakly positive for sox10 expression (L). MB-derived tumors were melanomas positive for sox10 (M), mlana (Q), and negative for the neuronal marks huc/hud (O).
(R) PCA plot of mitfa-driven tumors (n=6, M, red) and sox10-driven tumors (n=12, S, blue) for whole genome RNA-seq shows a separation at the transcriptional level.
