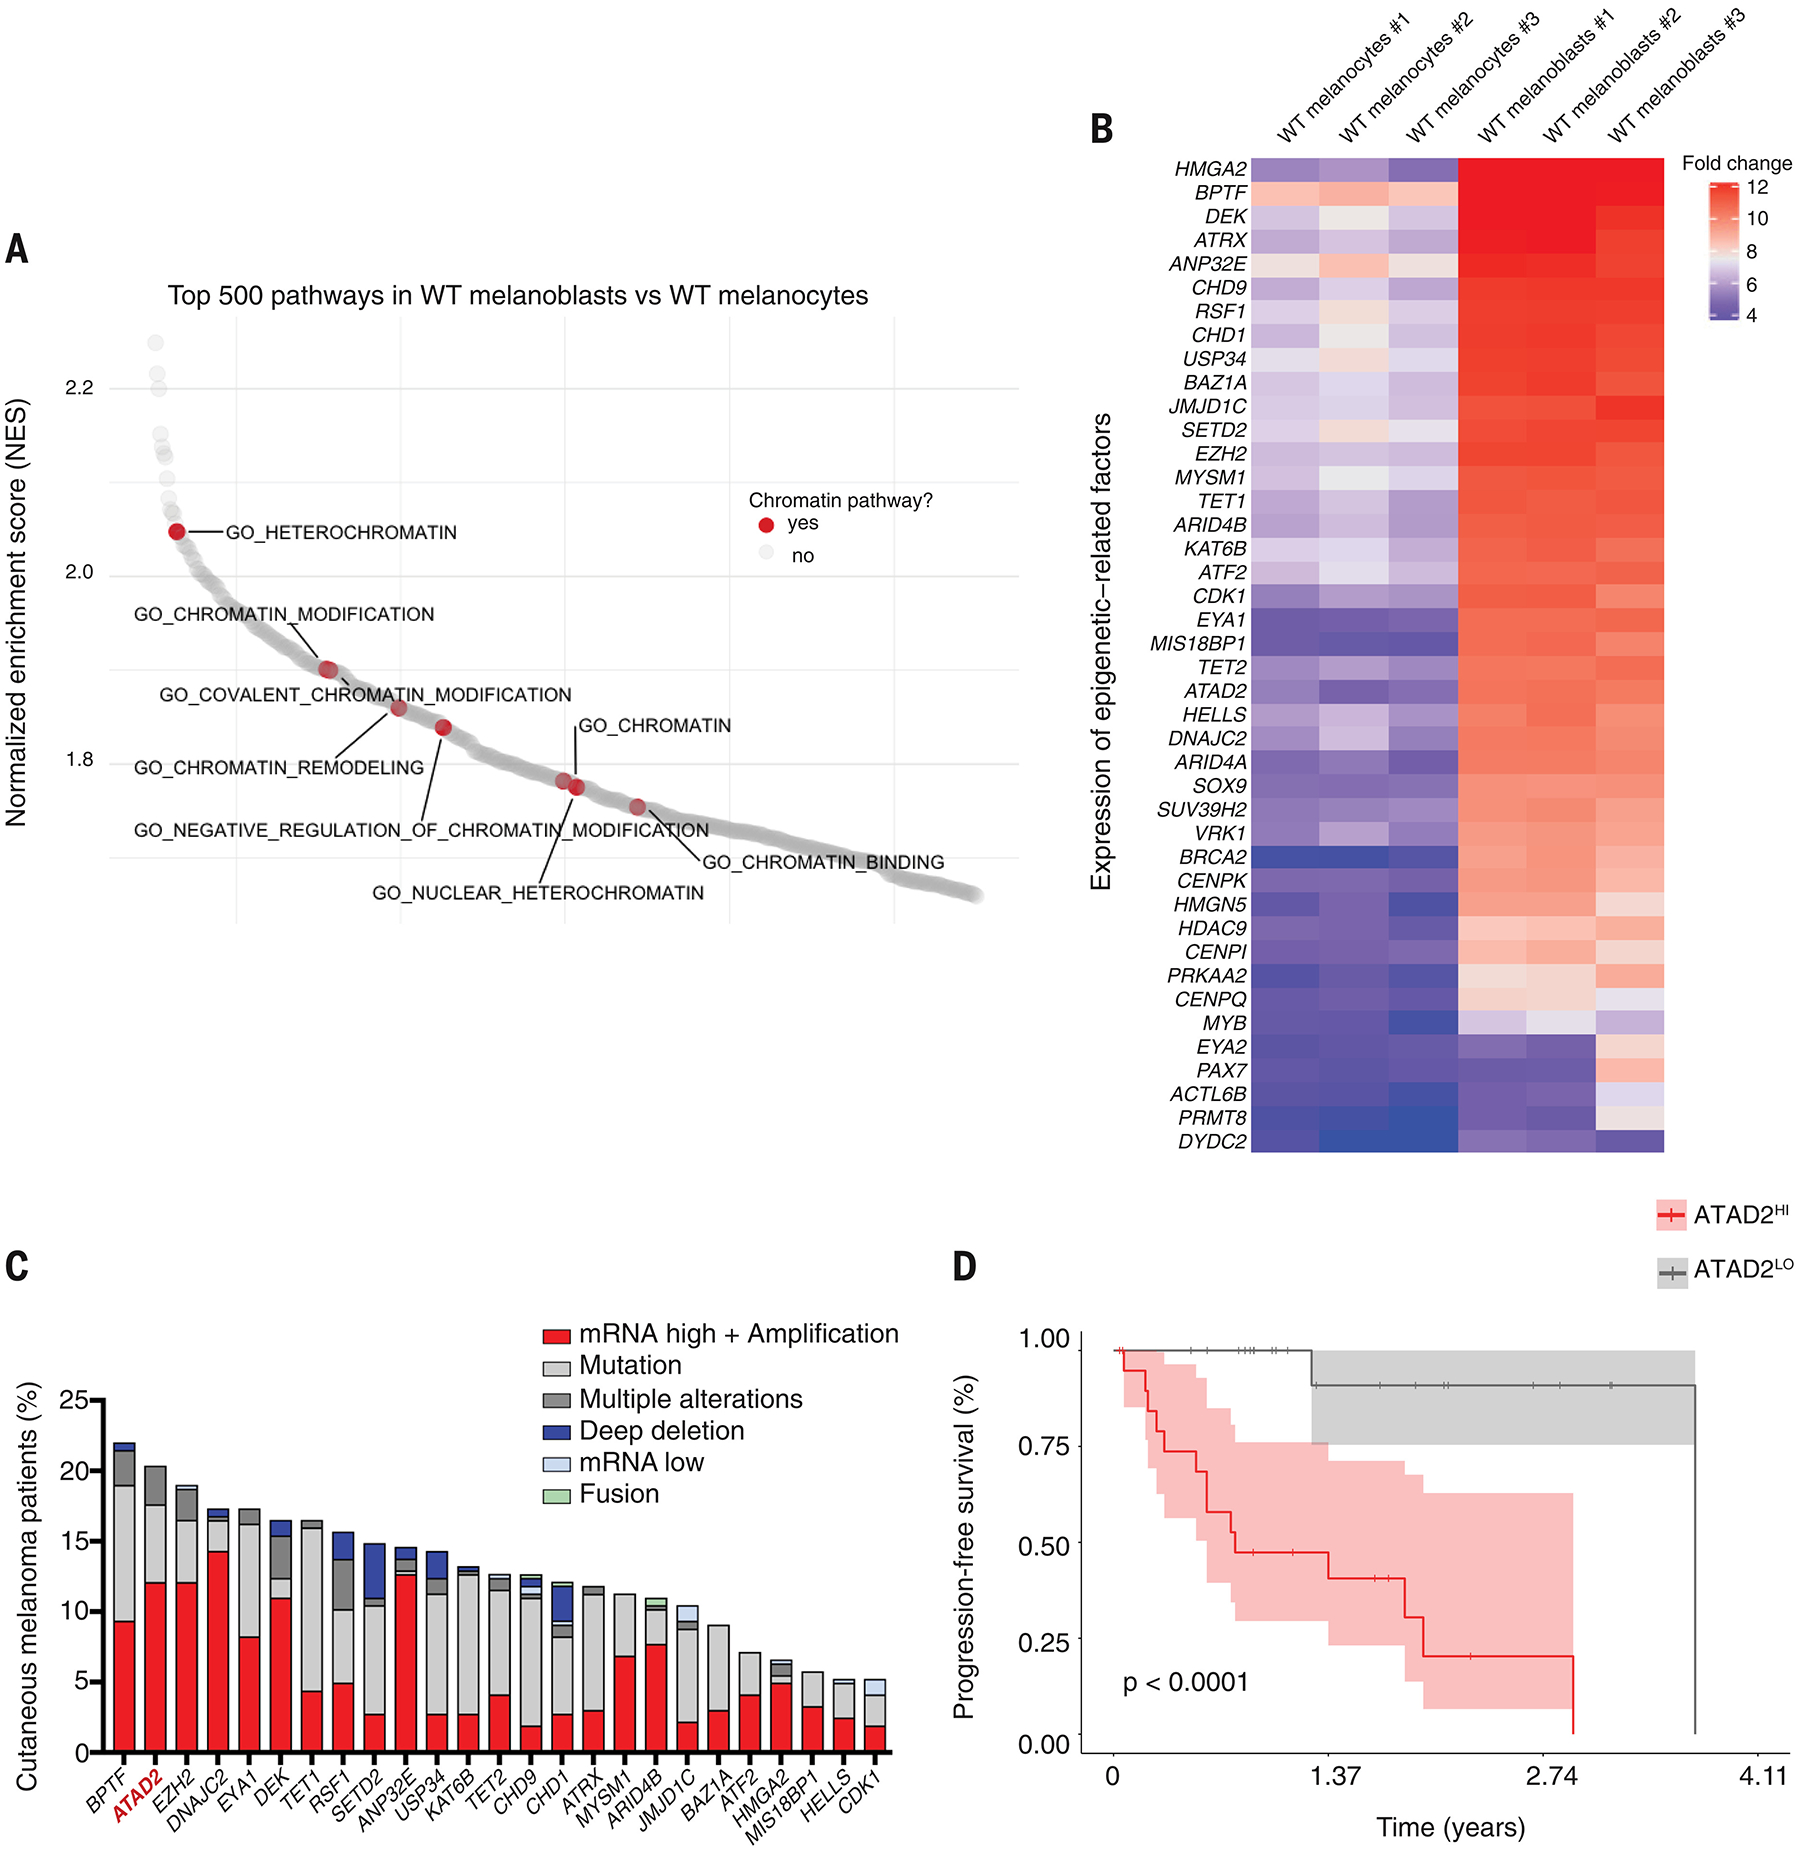
Fig. 3. Cancer competence is reflected by a distinct expression of chromatin-related genes and ATAD2 is a key chromatin factor shared between human PSC-derived melanoblasts and patient melanoma cells.

(A) Waterfall plot of the enriched pathways from the GSAA comparing WT melanoblasts to WT melanocytes. Chromatin-related pathways are highlighted in red.
(B) Heatmap depicting the differential expression of chromatin-related genes between WT melanoblasts and WT melanocytes. Normalized log2fold change.
(C) Alteration frequency of the top 25 epigenetic-related factors overexpressed in WT melanoblasts in TCGA SKCM melanoma patient samples.
(D) Kaplan-Meier overall survival curve of TCGA SKCM patients belonging either to the patients group with high levels of ATAD2 expression (ATAD2HI) or with low expression levels (ATAD2LO), log-rank p value reported.
