
Fig. 4. ATAD2 expression in melanocytes reshapes the chromatin around neural crest and melanoblast loci and reactivates a developmental signature.
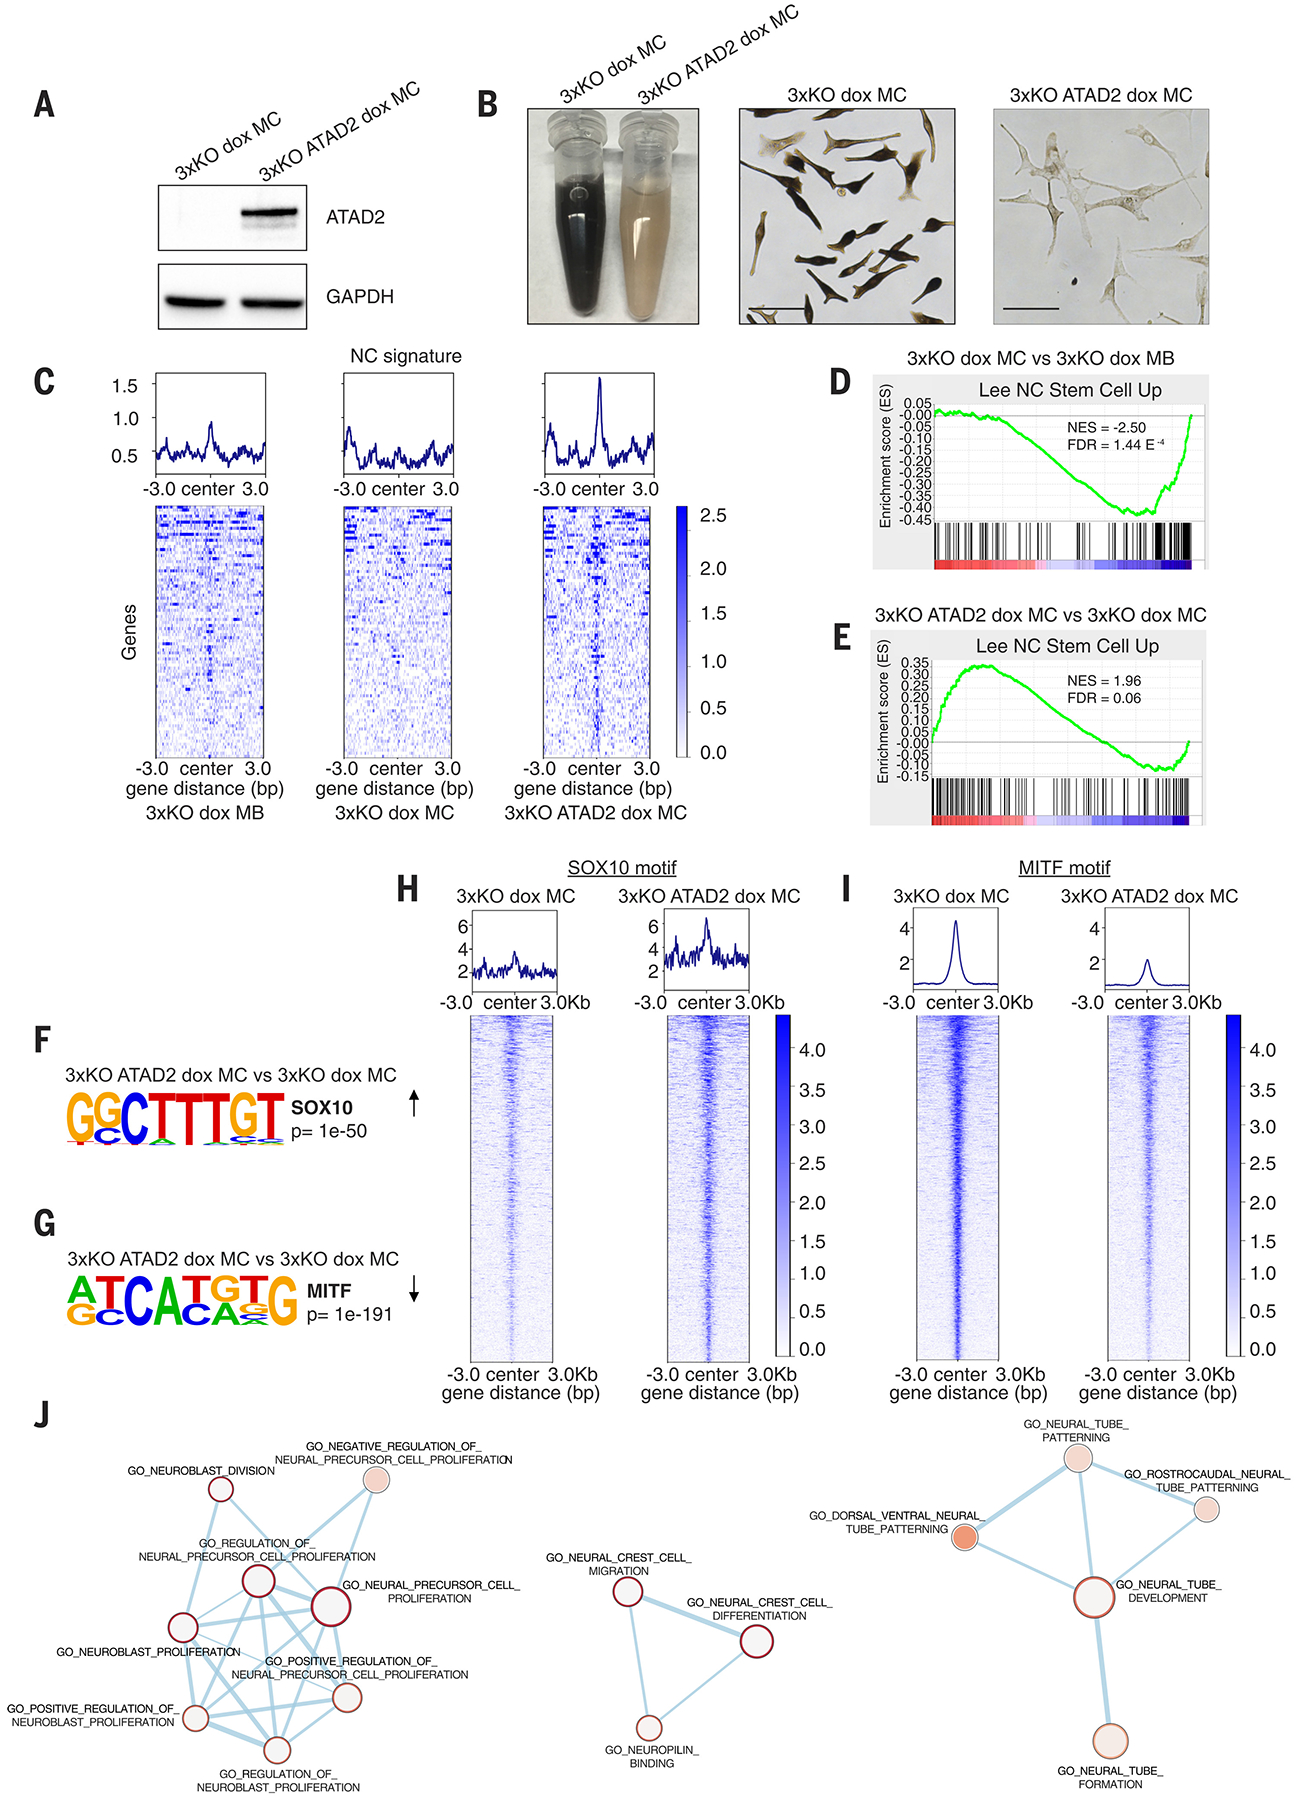
(A) Western blot for lenti-induced ATAD2 expression in 3xKO dox melanocytes.
(B) 3xKO dox melanocytes (right) and 3xKO ATAD2 dox melanocytes (left). Scale bars: 50 μm.
(C) Tornado plots of the Gene Set Enrichment Analysis (GSEA) of the ATAC-seq showing genes belonging to Lee NC Stem Cell Up gene set in 3xKO dox melanoblasts, 3xKO dox melanocytes, and 3xKO ATAD2 dox melanocytes.
(D-E) GSEA of the ATAC-seq of 3xKO dox melanocytes compared to 3xKO dox melanoblasts for Lee NC Stem Cell Up (NES = −2.50, FDR = 1.44 E−4) (D) and of 3xKO ATAD2 dox melanocytes compared to 3xKO dox melanocytes for Lee NC Stem Cell Up (NES = 1.96, FDR = 0.06) (E).
(F) Homer motif discovery shows that the SOX10 motif is one of the most enriched motifs (p value < 1e−50) in 3xKO ATAD2 dox melanocytes compared to 3xKO dox melanocytes.
(G) Homer motif discovery shows that the MITF motif is the most closed motif (p value < 1e−191) in 3xKO ATAD2 dox melanocytes compared to 3xKO dox melanocytes.
(H) Tornado plots depict any dynamic ATAC peak that contains the SOX10 motif, regardless of genomic location or gene annotation.
(I) Tornado plots depict any dynamic ATAC peak that contains the MITF motif, regardless of genomic location or gene annotation.
(J) Network analysis of the genes with increased accessibility for the SOX10 binding motif in 3xKO ATAD2 dox melanocytes compared to 3xKO dox melanocytes.