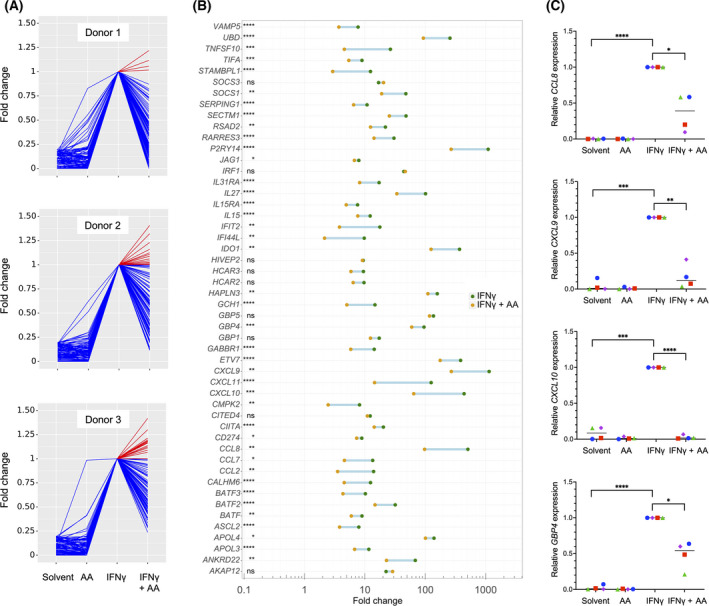
Fig. 2.

Impact of arachidonic acid (AA) on the transcriptome of IFNγ‐stimulated monocyte‐derived macrophages (MDMs). MDMs were treated and analyzed as in Fig. 1 except that IFNγ was used instead of INFβ. (A) RNA‐Seq results for the top IFNγ‐induced genes (fold change ≥ 5 for IFNγ versus solvent; counts per million ≥ 5 for IFNγ‐stimulated cells; n = 3 donors). Data were normalized for INFγ‐stimulated cells, and data points were connected by lines for improved visualization. Blue: IFNγ‐induced genes repressed by AA; red: IFNγ‐induced genes upregulated by AA. (B) IFNγ‐induced genes showing the strongest repression by AA (C) Validation of RNA‐Seq results by RT‐qPCR for CCL8, CXCL9, CXCL10 and GBP4. Cy0 values are expressed relative to IFNγ‐stimulated cells for n = 4 donors (represented by different symbols). Statistical significance was analyzed by paired t test (*P < 0.05; **P < 0.01; ***P < 0.001; ****P < 0.0001). Horizontal lines indicate the median.
