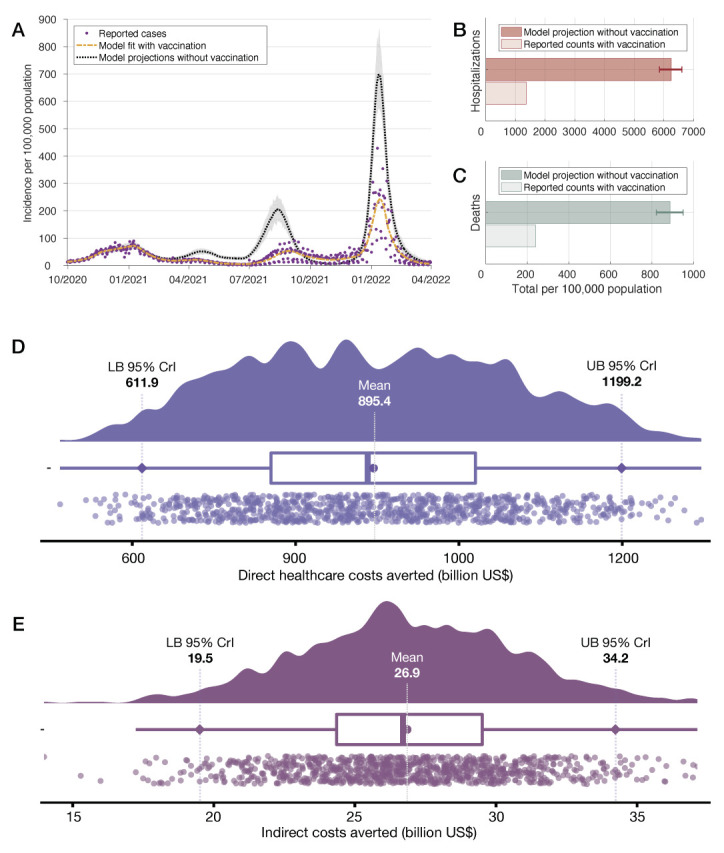
Figure 1.

Model fit to the daily national incidence of COVID-19 per 100 000 capita (Panel A). Model projections and 95% credible intervals for total hospitalizations (Panel B) and deaths (Panel C) are compared with the actual toll per 100 000 capita between December 12, 2020, and March 31, 2022. Direct health care costs (Panel D) and indirect costs (Panel E) averted by vaccination during the same period.
