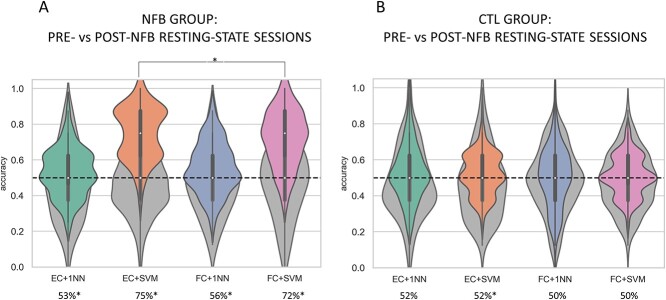
Fig. 2.
Classification results of pre- vs post-training resting-state sessions within each group. Classification performance according to features and classification algorithm is shown for the NFB group (A) and controls (B). The green violin plots represent accuracies distributions for the 1NN classifier combined with EC features, while the blue ones show 1NN performance using FC features. Accuracies related to SVM are shown in orange for EC and in pink for FC features. The gray violin plots in the background show accuracy distributions for each metric and classifier using surrogate data. Only for the NFB all the combinations between classifiers (SVM and 1NN) and type of features were significantly higher than chance-level (P<.05). Furthermore, the best accuracy in the NFB group was yielded by the SVM using EC features (mean accuracy = 75%), which was significantly higher than performance reached using FC features. In contrast, for the control group performance was not significantly higher than chance-level (P>.05), except for the combination EC+SVM which reached significance (P=.01) but showed a moderate average accuracy of 52%.

