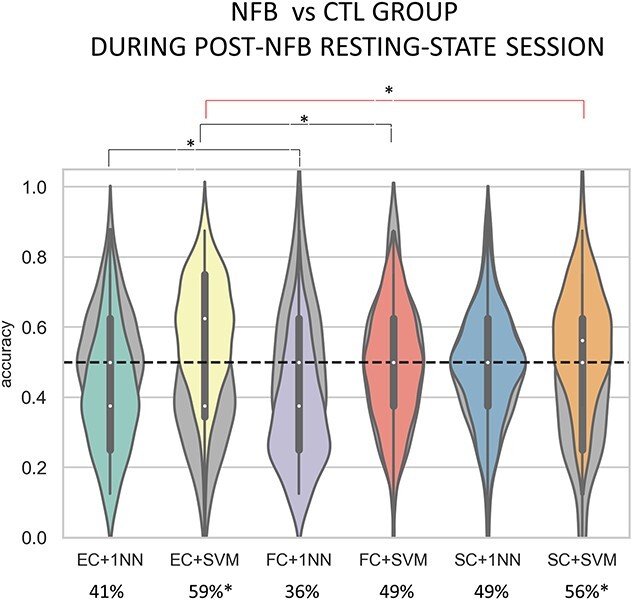
Fig. 4.

Accuracy distributions of group classification of resting-state sessions acquired post-training. Performances of 1NN and SVM are shown for each of the 3 feature sets. The green and yellow violin plots show accuracy distribution when using EC features for 1NN and SVM, respectively. Performance using FC features is colored in violet for 1NN and in red for SVM, while the blue (1NN) and orange (SVM) violin plots depict accuracy distribution using SC features. Lastly, the gray plots in the background reflect performance of each metric and classifier when using surrogate data. We found that using EC features with SVM classifier led to the best performance in distinguishing the 2 groups, yielding significantly higher average accuracy as compared with FC features and sightly improving performance as compared with SC features. Performances of 1NN was significantly different depending on the type of features, with EC yielding the best average accuracy. However, only performances of SVM were significantly above chance-level, except for FC features (P>.05).
