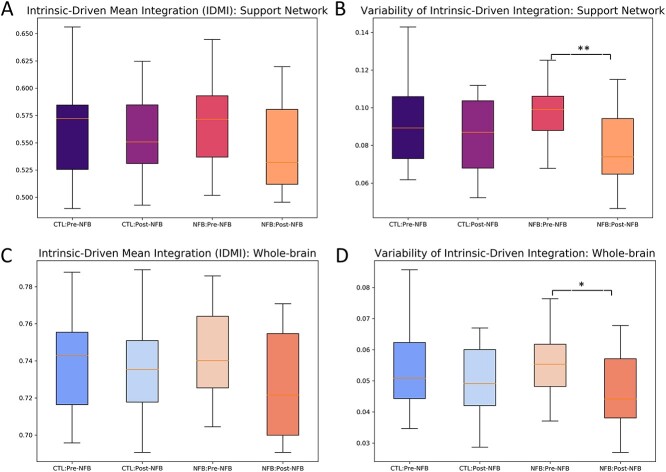
Fig. 5.
Intrinsic ignition profiles for both groups in the support network and at the whole-brain level. The boxplots show the mean IDMI (A) and variability of IDMI (B) values within the support network for each resting-state session of both groups. Boxplots in Figs. (A and B) colored in dark blue represent values of the resting-state session before the sham training, while the purple ones represent values of the post-training sessions for the CTL group. Mean IDMI and its variability are shown in red and in orange for the NFB group, for the pre-NFB and post-NFB resting-state sessions, respectively. We found significant differences in the variability of the IDMI for the NFB within the support network (P=.01), with the post-NFB sessions showing decreased metastability compared with the pre-NFB session. Figures C and D show IDMI and metastability values at the whole-brain level. Boxplots in blue and lighter blue represent values of the CTL group for the pre- and post- (sham) training, respectively. The light and dark orange boxplots show values of the pre- and post-NFB training in the NFB group. Again, we found the same effect of reduced variability (i.e. metastability) at for the post-NFB session in the NFB at the whole-brain level (P=.03). There were no significant differences within the CTL group for any of the 2 measures nor within the support network or at the whole brain.

