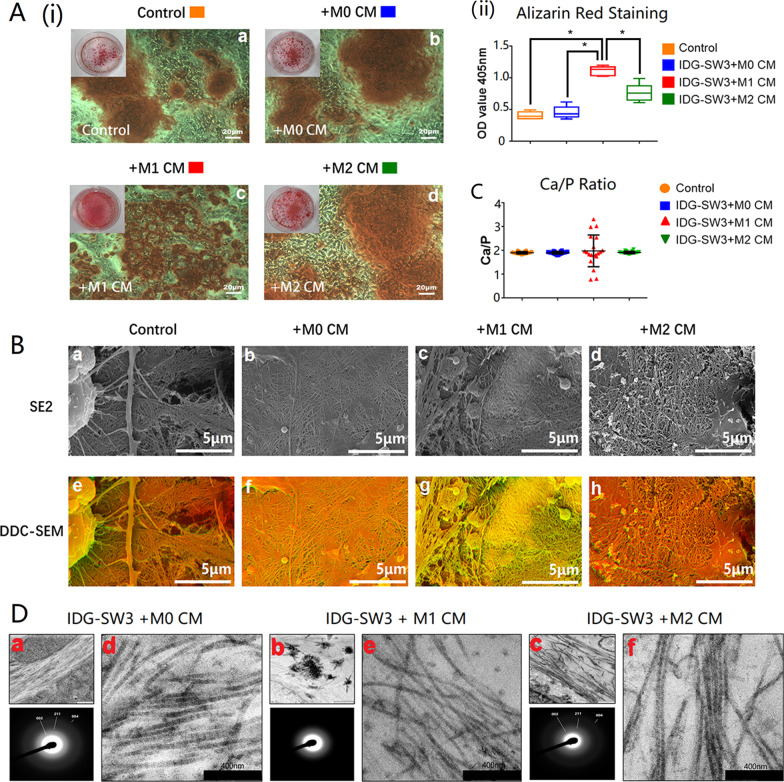
Fig. 2.
M1 macrophages negatively affected osteocyte mineralization. A Alizarin Red S staining images of osteocytes cultured with macrophage-derived conditioned medium. The box plot graph showed the average optical density (OD) value of Alizarin Red S staining and the OD values were shown as the mean ± SD (*p < 0.05, one-way ANOVA); B SEM images of mineralized collagen fibers synthesized from macrophage-derived conditioned medium treated osteocytes. Images captured by SE2 mode were displayed above and DDC-SEM images were displayed underneath the SE2 images (scale bars represented 5 μm); C Ca/P ratio of mineralized collagen was detected with EDS by randomly measuring 20 points from each sample; D TEM images and X-ray diffraction patterns demonstrated the ultrastructure of mineralized collagen synthesized by macrophage-stimulated osteocytes

