Fig. 3.
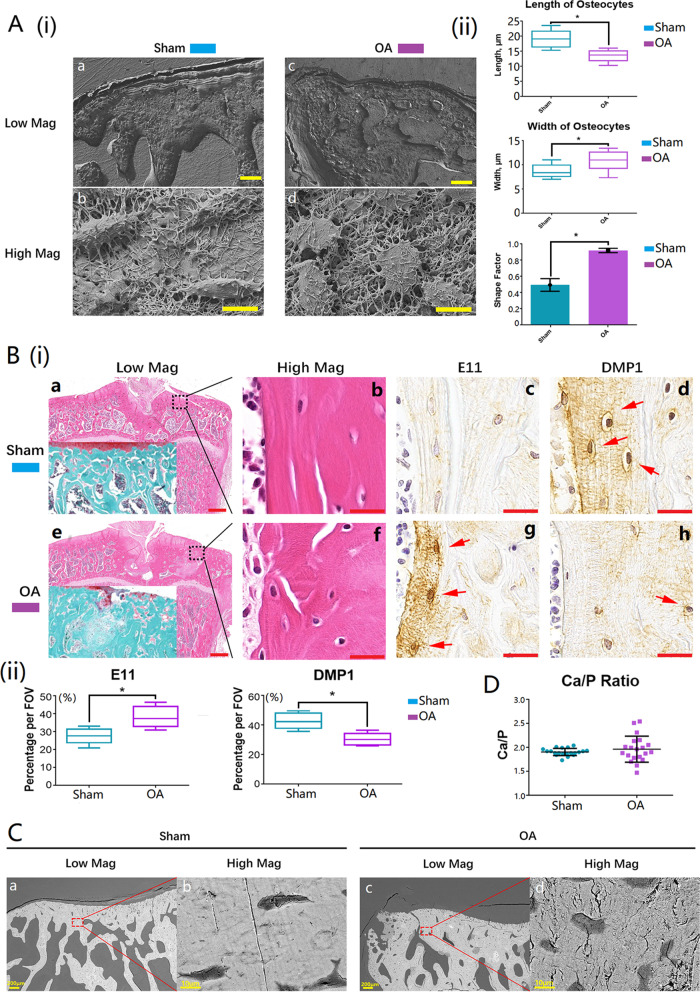
Osteocytes were immature and mineralization was abnormal in inflammatory bone remodeling areas in OA samples. A(i) Representative SEM morphological images of osteocytes in normal and OA inflammatory bone remodeling areas (a and c: scale bars represented 100 μm in low magnification; b and d: scale bars represented 10 μm in high magnification); A(ii) the box plot and bar graphs showed the morphology changes of osteocytes in normal and OA samples, 20 randomly selected cells from each sample were analyzed, and data shown as the mean ± SD (*p < 0.05, t-test); B(i) H&E, Safranin O, and IHC staining images of normal and OA inflammatory bone remodeling areas (E11: early osteocyte marker; DMP1: mature osteocyte marker; red arrows showed the positive cells; a and e: scale bars represented 500 μm in low magnification; b, c, d, f, g, and h: scale bars represented 20 μm in high magnification); B(ii) the box plot graphs showed the percentage of the positive cells per field of view (*p < 0.05, t-test); C BSEM images of subchondral bone remodeling areas from normal and OA bones (the magnification was ×100; scale bars represented 200 μm); D Ca/P ratios of bone remodeling areas from normal and OA subchondral bones were detected with EDS, and 20 randomly chosen points were measured

