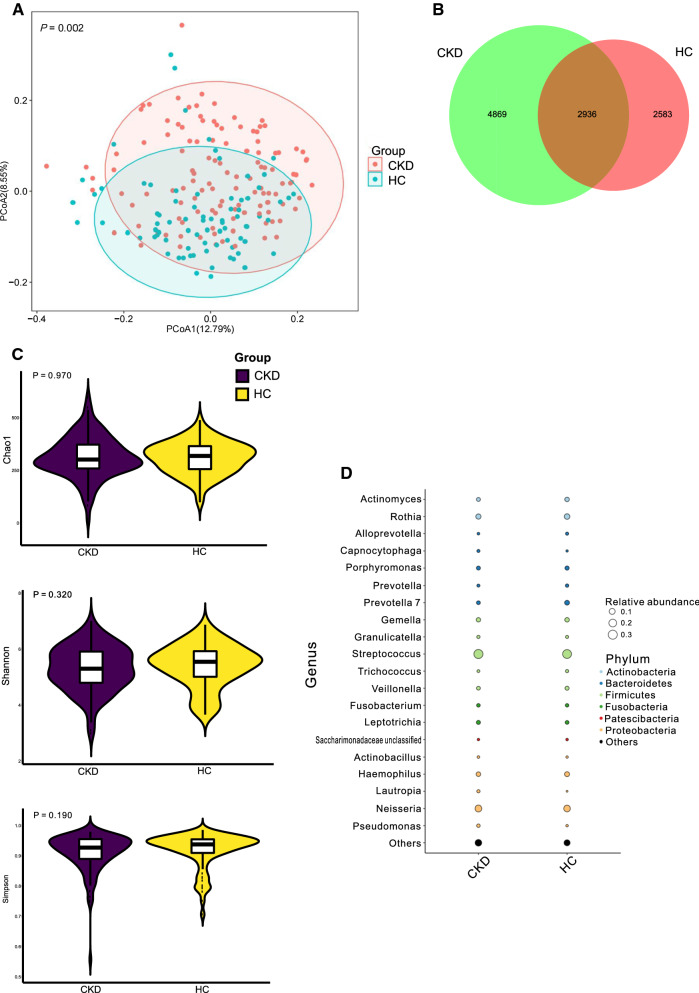
Fig. 1.
Microbial community, diversity, and composition A. PCoA based on Bray–Curtis distances at ASV level showed different microbial compositions between groups of CKD patients and HCs (P < 0.05). Permutational multivariate analysis of variance (PERMANOVA) was performed for statistical comparisons of samples in the two cohorts. P-value was adjusted by the Benjamini and Hochberg false discovery rate (FDR). B. Venn diagram showing a dissimilar number of ASVs shared by the groups of CKD and HC. C. Bacterial richness and diversity measured by Chao1, Shannon, and Simpson were calculated at the microbial ASV level. Wilcoxon rank-sum test was performed and adjusted by Benjamini and Hochberg false discovery rate (FDR). D. Microbial profile at the phylum and genus level. Bubble plot showing the abundances of bacterial taxa as a percentage of the entire bacteria population detected in the groups of CKD and HC. The taxonomic classification levels of phylum and genus are displayed. The relative abundance of a genus in a group is scaled to match the size of the corresponding point

