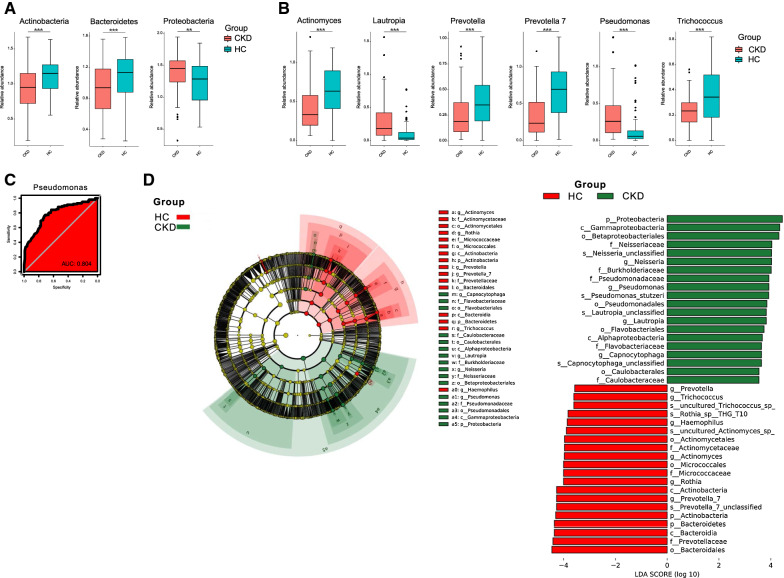
Fig. 2.
Bacterial taxon comparisons A. Microbial phylum was differentially abundant between CKD patients and HCs. Only the phylum with above 1% is displayed. P-value was calculated using Wilcoxon rank-sum test and adjusted by Benjamini and Hochberg’s false discovery rate (FDR). ** and *** indicate P < 0.01 and P < 0.001, respectively. B. Microbial genus was differentially abundant between CKD patients and HCs. Only the phylum with above 1% is displayed. P-value was calculated using Wilcoxon rank-sum test and adjusted by Benjamini and Hochberg’s false discovery rate (FDR). ** and *** indicate P < 0.01 and P < 0.001, respectively. C. The area under the ROC curve (AUC) of salivary microbiome based on CKD classification. Random forest classifiers were sued to separate CKD patients and HC based on ASV-level composition. The red area represents the 95% confidence interval shape. D. Linear Discriminant Analysis (LDA) Effect Size (LEfSe) plot of taxonomic biomarkers identified in the salivary microbiome of participants. Specific bacterial traits are found at all taxon levels. The threshold for the logarithmic discriminant analysis (LDA) score was 3

