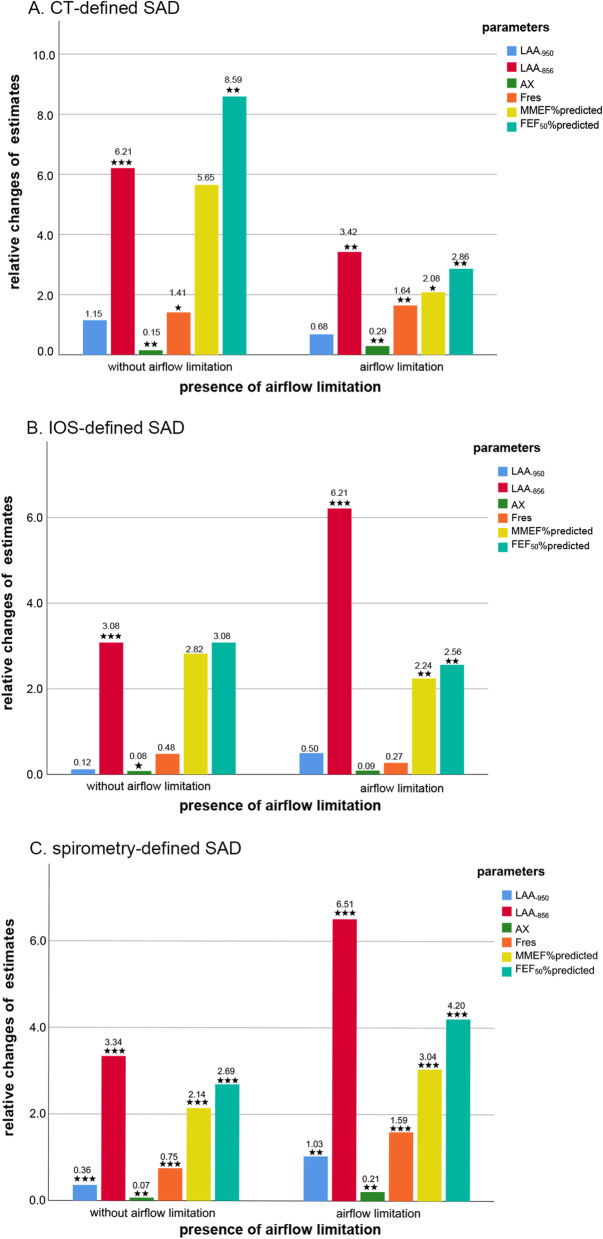
Fig. 3.
The relative effects of age on the severity of SAD (indicated by markers from CT, IOS and spirometry parameters) in SAD subjects with and without airflow limitation. Note: Panel A was for SAD defined by CT. Panel B was for SAD defined by IOS. Panel C was for SAD defined by spirometry. The relative changes of estimates were abstracted from the Unstandardized β estimates of the multivariate regression models and transformed to their absolute values. These changes are caused by the age increasing per 10 years. *P value < 0.05, **P value < 0.01, ***P value < 0.001. Definitions of abbreviations see Table 1

