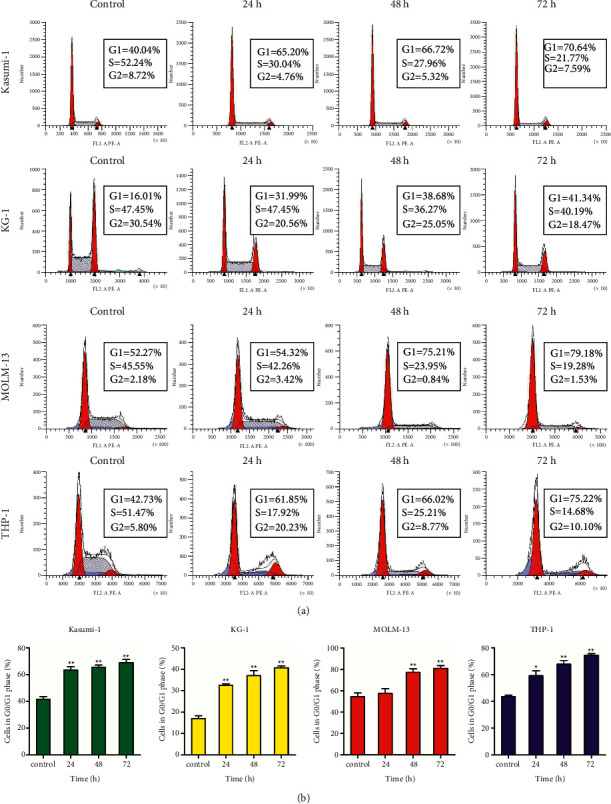
Figure 4.

I3 induces G0/G1 cell cycle exit in Kasumi-1, KG-1, MOLM-13, and THP-1 cells. (a) Cells were treated with 0.25, 1.2, 0.9, or 1.2 μM of I3, respectively, for 24, 48, or 72 h and detected by flow cytometry. (b) Graph bars show the percentage of cells in the G0/G1 phase (∗p < 0.05, ∗∗p < 0.01).
