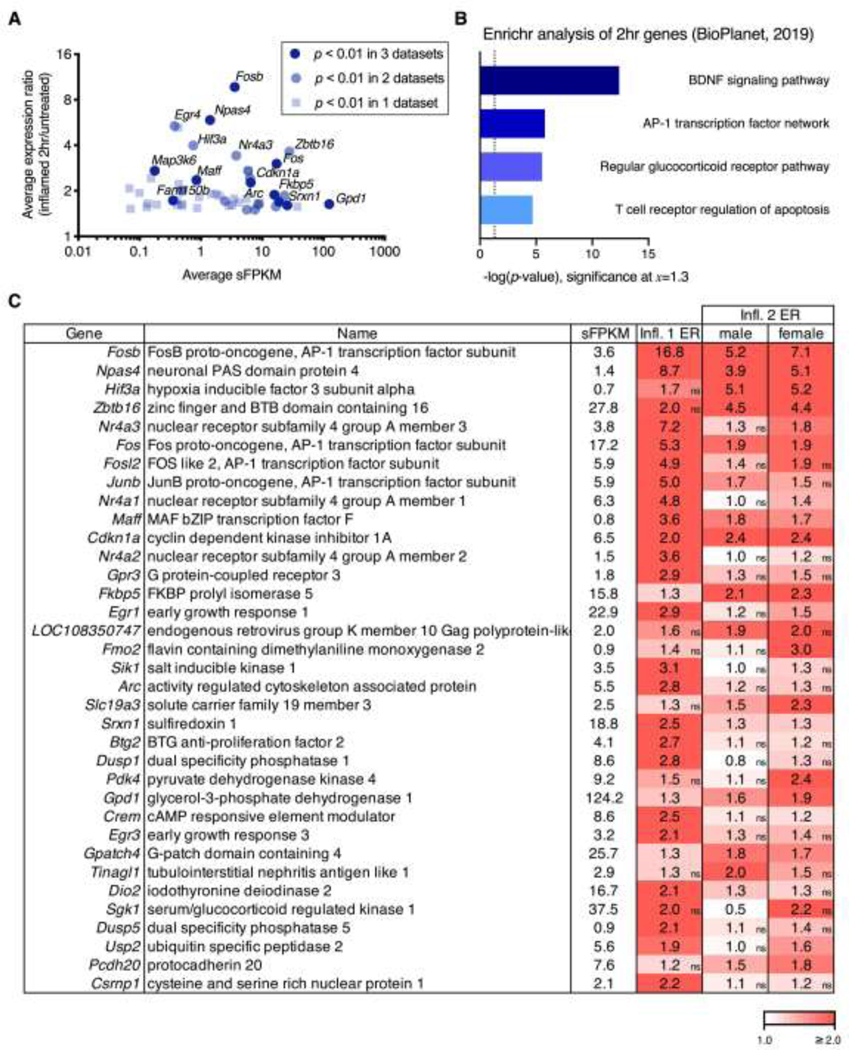
Figure 3. Overall changes at 2 hrs after peripheral carrageenan in the ipsilateral dorsal spinal cord.
For the three datasets in which a 2 hr timepoint was collected (Inflammation 1, Inflammation 2 male, and Inflammation 2 female), sFPKMs from ipsilateral and control (naïve) samples were averaged across all three datasets. The grand average sFPKM was plotted against a grand average of the expression ratio computed by averaging the ER at the 2 hr timepoint across all three datasets. A. The selection criteria for graphing was average expression ratio above 50% change (≥1.5 or ≤0.67). Genes that met this expression ratio were then colored based on how many of the three datasets they were significant in at p < 0.01. B. The top 35 genes significant in any dataset were selected based on highest grand average expression ratio (2 hr:control) after filtering for average sFPKM ≥ 0.5. These genes were run through Enrichr for pathway enrichment analysis, and the -log p-value was plotted, yielding BDNF signaling pathway, and the AP-1 transcription factor network as the top results (lowest p-value). The top 6 predicted pathways are consistent with activation of neuronal immediate early genes such as Fos and Jun which are part of the AP-1 transcription complex, as well as the activation of the Bdnf pathway which is closely coupled to neuroplastic events. C. The 35 top genes used in the Enrichr analysis are tabulated and colored by expression ratio. Non-significant expression ratios are indicated by an “ns” in the bottom right corner of cells that did not meet significance in a given comparison.

