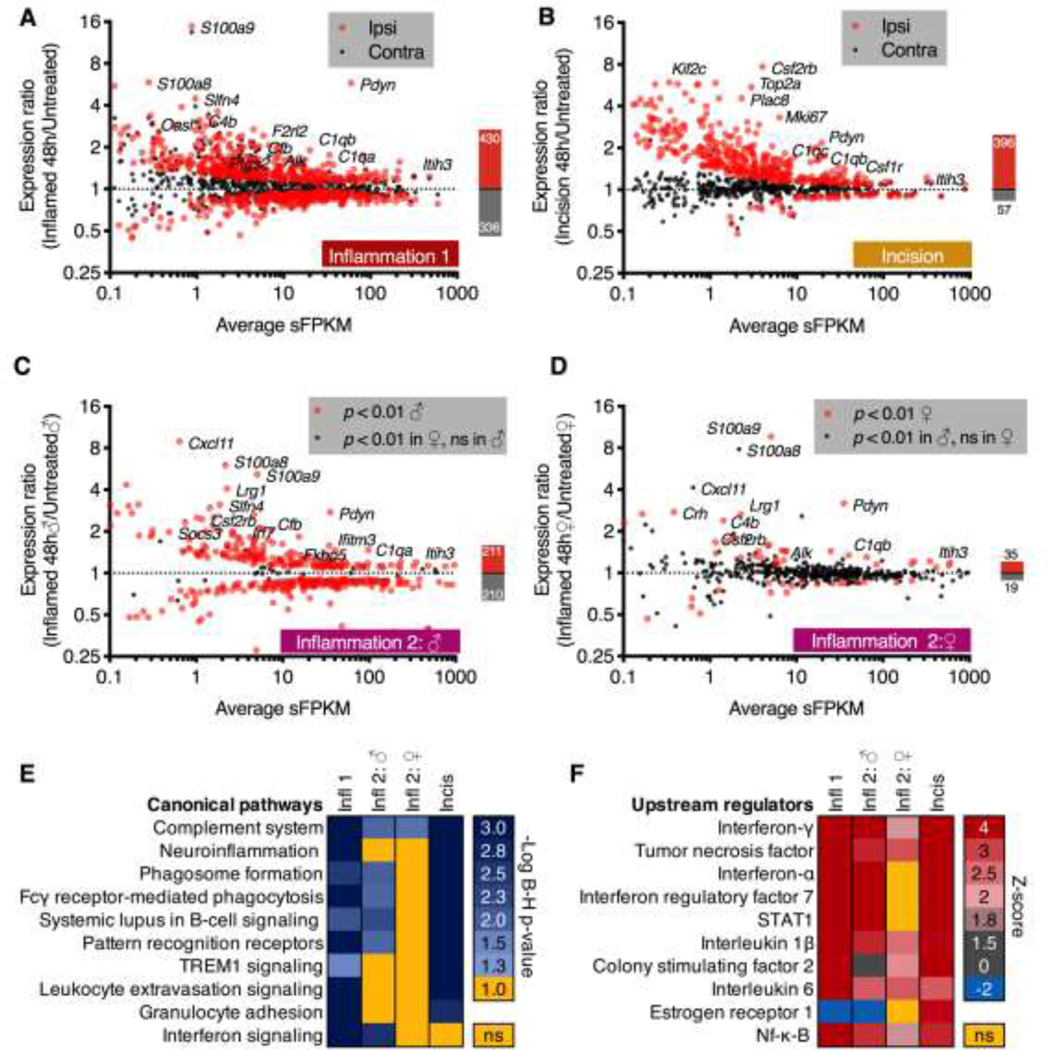
Figure 4. Differentially expressed genes at 48 hrs after inflammation or incision.

The dorsal spinal cord was dissected from rats with unilateral hind paw carrageenan or surgical incision, which are models of inflammatory and post-operative pain conditions, respectively. For each dataset, DESeq2 was performed on the naïve control vs. 48 hrs comparison (control vs. ipsilateral and control vs. contralateral), and significant (adj. p < 0.01) genes were plotted as average expression in sFPKM vs. expression ratio (48 hrs/untreated). Ipsilateral expression ratios are displayed as red points, and the corresponding contralateral expression ratios for these genes are displayed as black points. These data are shown A. for the Inflammation 1 dataset and B. for the Incision dataset. Notably, the Incision dataset showed a more unilateral induction as indicated by the presence of the majority of black dots (contralateral) around the y=1 (no change) dotted line. C, D. A second inflammation experiment (Inflammation 2) was performed on both male and female animals following similar parameters as in Inflammation 1 (panel A). The contralateral side was not analyzed in these experiments. C. Expression ratios for genes significant in the males are plotted as red points, and genes significant in the female but not male animals are plotted as black points. For the control vs. 48 hr timepoint for male animals a large number of significant genes were observed including many of the most highly significant genes in the original dataset (Pdyn, C1qa, C4b, for example). D. Expression ratios for genes significant in the females are plotted as red points. Genes significant in the males but not the females are plotted as black points. Females in general showed far fewer significant genes, although notably some of the most highly significant genes in the other datasets (Pdyn, C1qa, C1qb) were elevated. These four DEG lists and expression ratios were used to predict canonical pathway and upstream regulator modulation in Ingenuity. E. Canonical pathway activation was assessed in a comparison analysis, and significant pathways were exported into a heatmap. Within the heatmap, cells represent the -Log of the Benjamini-Hochberg corrected p < 0.05 (equal to 1.3). Rows are sorted by level of significance with nonsignificant cells colored in yellow. Most of the non-significant pathways are found in the female dataset. F. Upstream regulators were plotted similarly, with the Z-score of activation used. For these values, the majority of significant Z-scores were positive indicating activation. Note that many of these pathways are related to innate immune activation.
