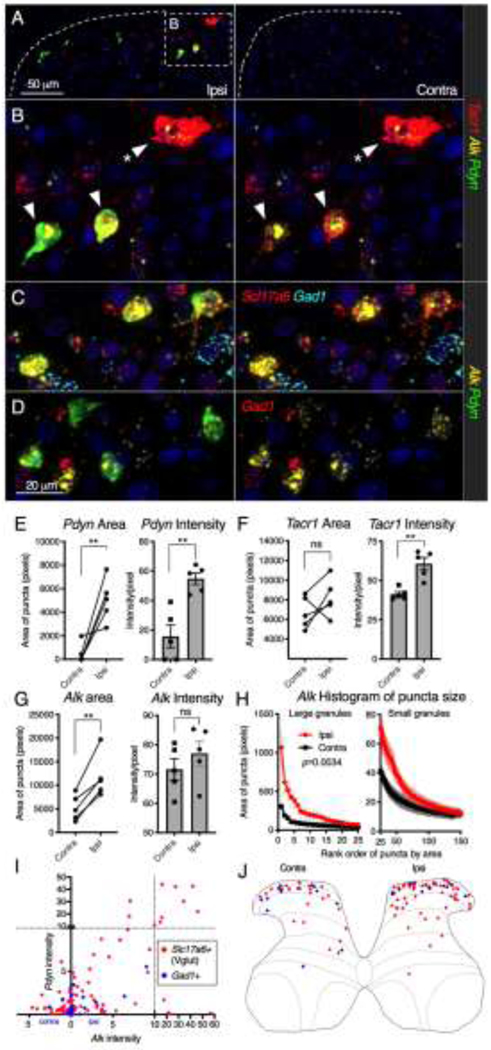
Figure 9. Fluorescent in situ hybridization for inflamed spinal dorsal horn at 48 hrs.
Sections of lumbar spinal cord were taken from unilaterally inflamed animals (48 hrs) and multiplex fluorescent in situ hybridization was performed. A. Triple label for Tacr1 (red), Alk (yellow), and Pdyn (green) with a counterstain (DAPI, blue) revealed a unilateral increase in each of these transcripts in the dorsal spinal cord. B. The densely-positive Pdyn cells in the superficial medial dorsal spinal cord show colocalization of Alk and Tacr1 in a large superficial neuron (arrowhead, asterisk) and colocalization between Alk and Pdyn in two smaller neurons with less Tacr1 reactivity. C. The Alk/Pdyn co-positive subset was further investigated and shown to also co-label with Slc17a6 (Vglut2), a marker of glutamatergic neurons. D. Conversely, hybridization of the section for Gad1 showed that the Alk/Pdyn co-positive subset were Gad1 negative. E. The area and intensity/pixel of Pdyn signal was significantly increased ipsilaterally. F. Intensity/pixel, but not area of the Tacr1 signal was increased. G. Area but not intensity/pixel of Alk was increased. H. Rank order plots of regions using thresholding by area are shown for Alk, revealing that the effect is driven by the appearance of larger agglomerated regions of Alk reactivity. I. Pdyn/Slc17a6 copositive cells (red) and Pdyn/Gad1 copositive cells (blue) were identified in the superficial dorsal quadrants both ipsilateral and contralateral to the site of inflammation in lumbar cords from 3 inflamed animals. Pdyn and Alk signal intensities of identified cells were measured and plotted; contralateral and ipsilateral cells are graphed in the negative and positive x-axis, respectively. A subset of densely Pdyn/Alk/Slc17a6 copositive cells is found in the ipsilateral dorsal quadrant. J. The laminar distribution of Pdyn+/Slc17a6+ (red) and Pdyn+/Gad1+ (blue) cells from inflamed animals are displayed for two of the three animals. The third shows a similar result, and is shown in Supplementary Figure 8. Statistics were performed using paired T-tests; **, p < 0.01; N=5. All significant results were at least p < 0.05 with Mann-Whitney U-test. Error bars represent standard error of the mean.

