Figure 5.

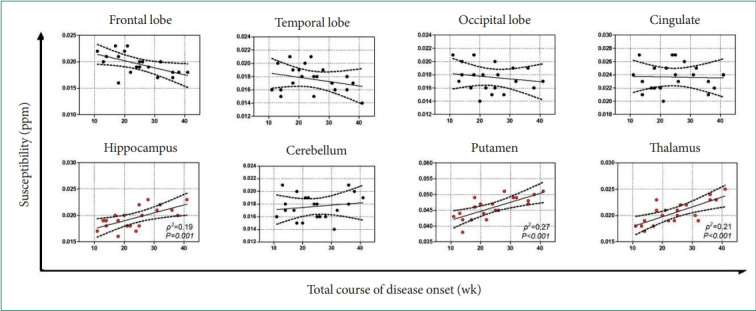
Median susceptibility for patients with depression plotted in relation to the total course of disease onset. Dashed lines represent 95% confidence intervals.

Median susceptibility for patients with depression plotted in relation to the total course of disease onset. Dashed lines represent 95% confidence intervals.