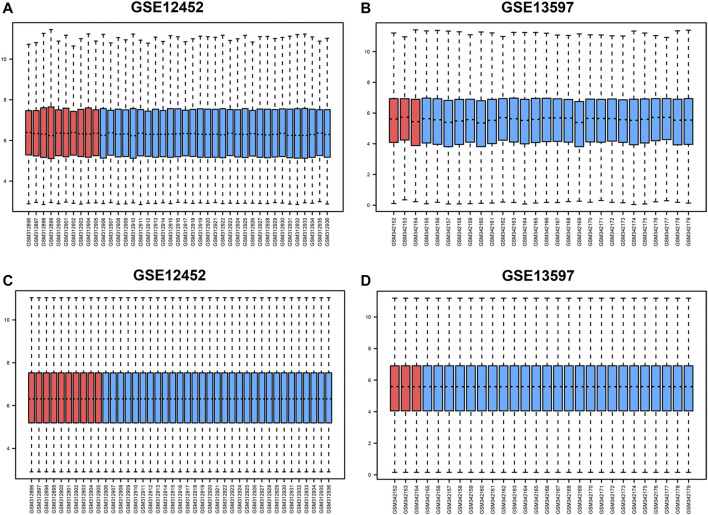
FIGURE 1.
Box diagram before and after standardization of GSE12452 and GSE13597 datasets. (A–B) Box diagrams before standardization of GSE12452 and GSE13597; (C–D). Box diagrams after standardization of GSE12452 and GSE13597. Blue represents tumor samples, and red represents normal samples. NPC, nasopharyngeal carcinoma; GEO, Gene Expression Omnibus.

