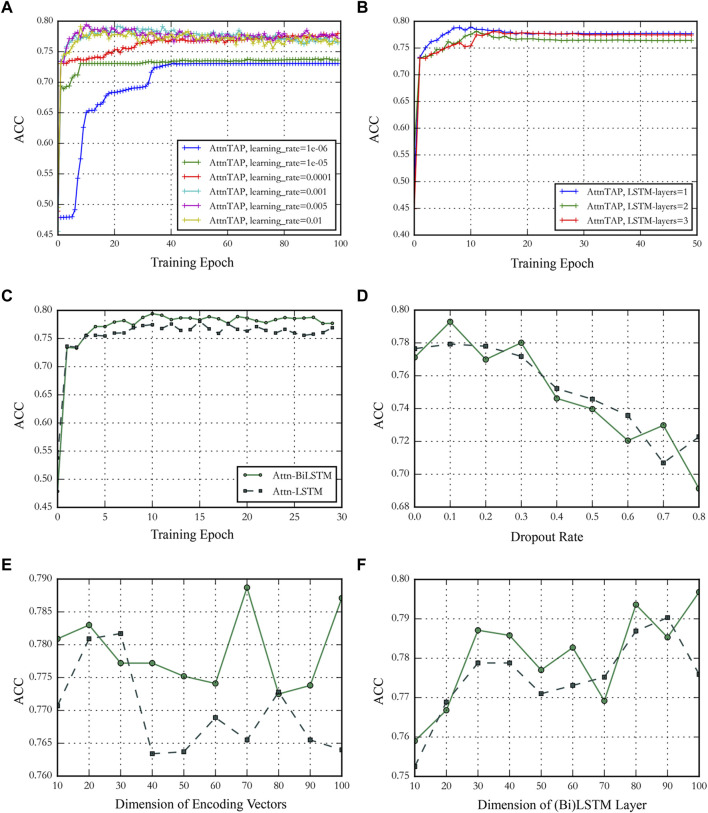
FIGURE 4.
The performance of AttnTAP with different hyperparameters. (A,B) Panels showed the performance of AttnTAP with different learning rates and bi-directional long short-term (BiLSTM) layer numbers. (C–F) Panels depicted the performance of AttnTAP using LSTM/BiLSTM with different training epochs, dropout rates, dimensions of encoding vectors, and LSTM/BiLSTM layers, respectively.

