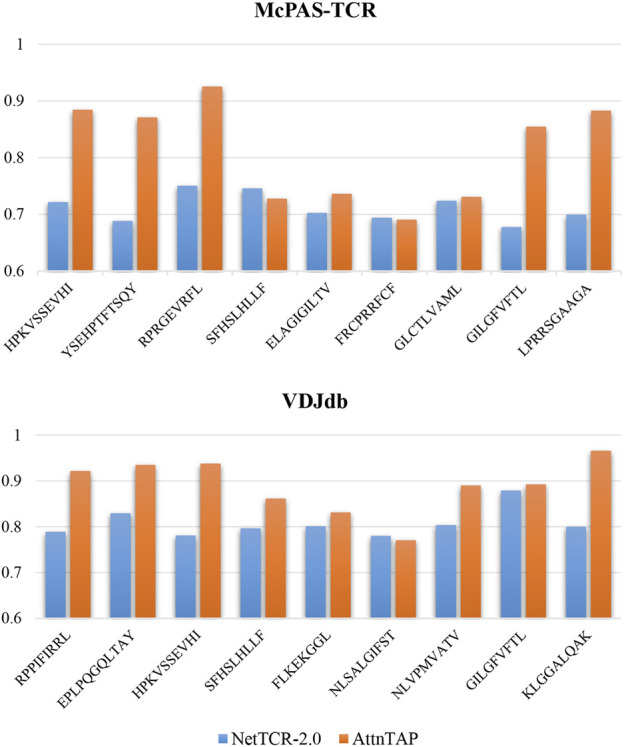
FIGURE 5.

The prediction performance of AttnTAP and NetTCR-2.0 on different peptides. We first selected nine peptides according to abundance for the McPAS-TCR and VDJdb datasets, respectively, of which three were of lowest abundance (McPAS-TCR: HPKVSSEVHI, YSEHPTFTSQY, RPRGEVRFL; VDJdb: RPPIFIRRL, EPLPQGQLTAY, HPKVSSEVHI), three were of intermediate abundance (McPAS-TCR: SFHSLHLLF, ELAGIGILTV, FRCPRRFCF; VDJdb: SFHSLHLLF, FLKEKGGL, NLSALGIFST), and three were of highest abundance (McPAS-TCR: GLCTLVAML, GILGFVFTL, LPRRSGAAGA; VDJdb: NLVPMVATV, GILGFVFTL, KLGGALQAK). Then, we performed five-fold cross-validation on NetTCR-2.0 and AttnTAP using only TCR β chain CDR3 sequences, where we used all training data to train the models but only used the test data containing the corresponding peptide to test the models. The average accuracy was used to evaluate their prediction performance.
