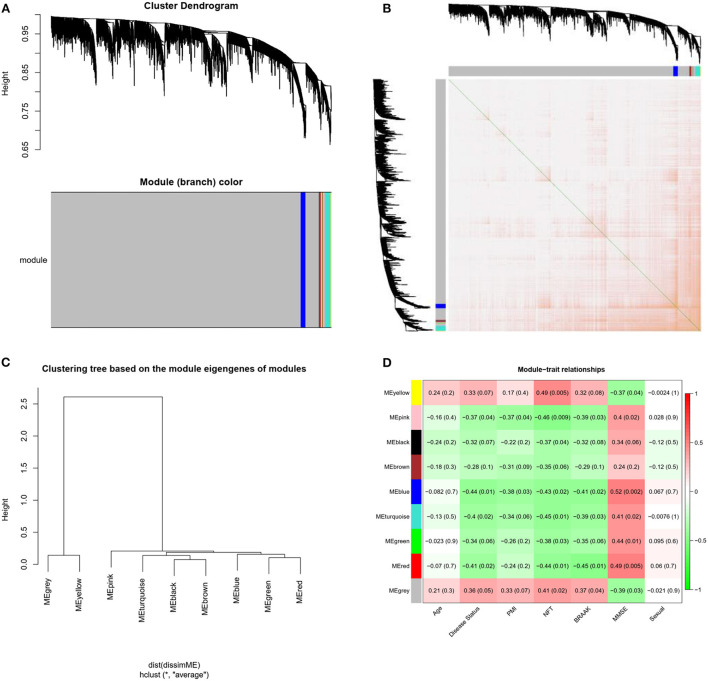
Figure 3.
Modules related to the clinical traits of AD. (A) Cluster dendrogram of genes: Heatmap of co-expressed genes. Different colors shown on X and Y axes denote different modules. (B) Heat map of co-expressed genes. Different colors on X and Y axes represent different modules. The depth of yellow color indicates the degree of connection between modules. (C) Dendrogram of Module Eigengenes(MEs) obtained through WGCNA. (D) Correlation between modules and traits. Red and blue represents high adjacency and low adjacency, respectively. PMI, postmortem interval; NFT, neurofibrillary tangle; MMSE, mini-mental state examination.

