Figure 5.

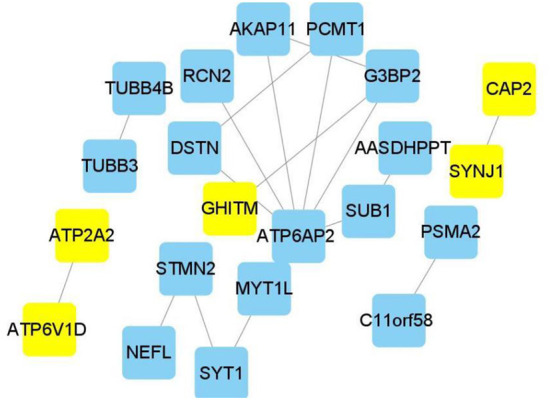
Hub genes in Alzheimer's disease module. Construction of a network and hub genes. Hub genes highlighted in Cytoscape module visualization. The network yellow color box represents hub genes. The lines indicate correlation between genes.

Hub genes in Alzheimer's disease module. Construction of a network and hub genes. Hub genes highlighted in Cytoscape module visualization. The network yellow color box represents hub genes. The lines indicate correlation between genes.