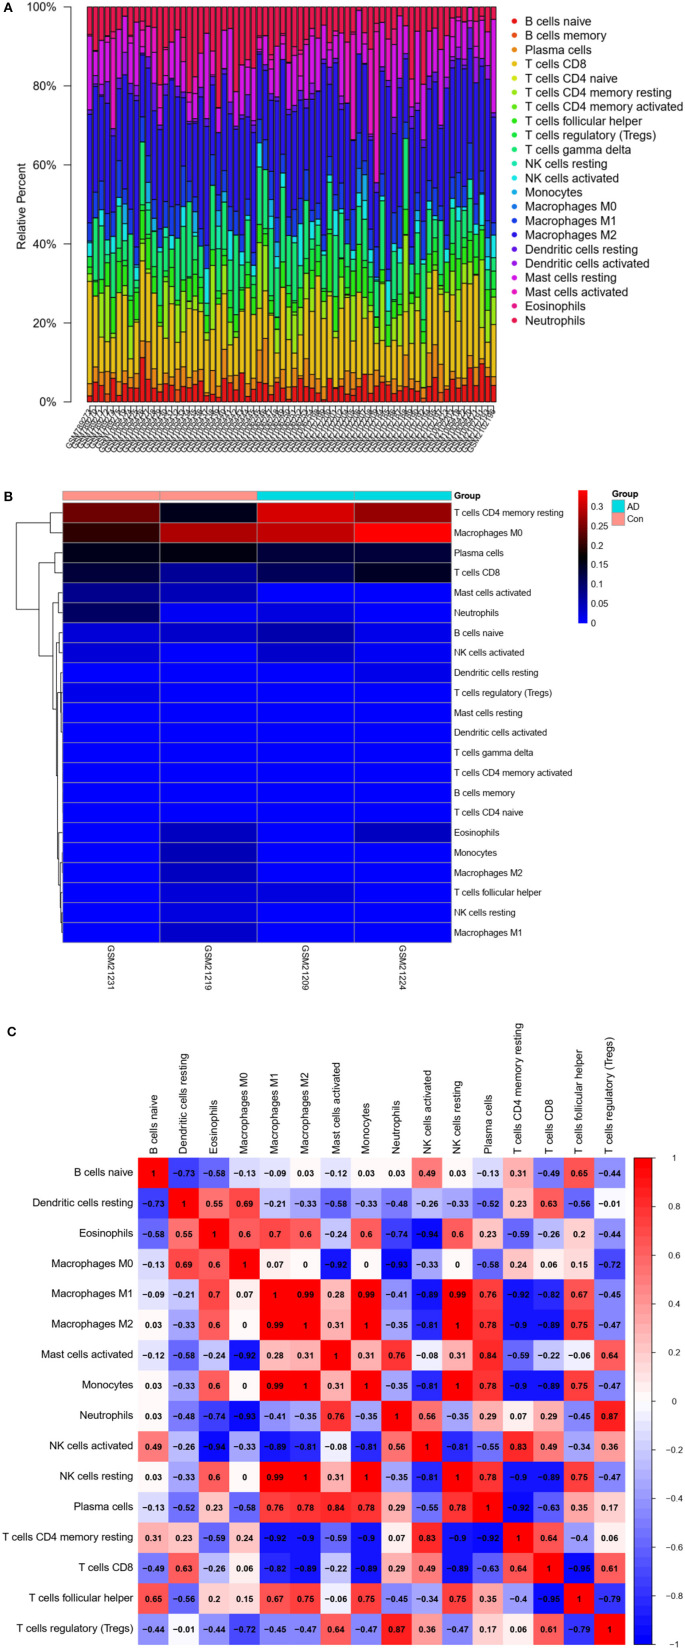
Figure 8.
Immune infiltration (immune cell type gene enrichment) in Alzheimer's disease. (A) The relative percentage of 22 types of immune cells: Percentage of immune cell types in Alzheimer's disease and Control. (B) A heat map of 22 types of immune cells: Correlation between 22 types of immune cells using their expression data in CIBERSORT tool's database. (C) Distribution and visualization of immune cell infiltration. Correlation matrix showing the composition of all 22 immune cell subtypes. Horizontal and vertical axes represent immune cell subtypes. High, low, and unchanged immune cell subtype compositions are shown in red, blue, and white, respectively.

