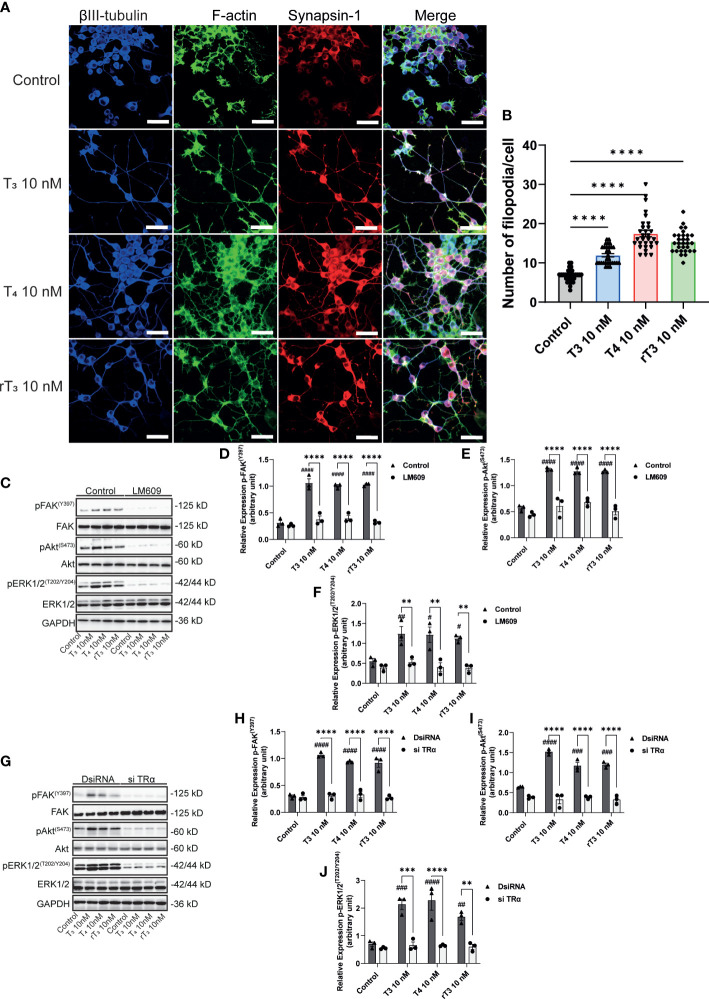
Figure 7.
Effect of TH on F-actin formation and phosphorylation of FAK, Akt, and ERK1/2. A. Representative photomicrographs showing the effects of TH on the filopodia formation in Neuro-2A cells. Differentiation of Neuro-2A cells was induced by serum starvation for one to three days, followed by immunostaining with β-tubulin III (blue), F-actin (green), and synapsin-1 (red). (B) Quantitative analysis of filopodia formation in Neuro-2A cells after TH treatment. (C) Representative images of blots for pFAK, FAK, pAkt, Akt, pERK1/2, ERK1/2, and GAPDH levels following TH treatment and co-exposure to 2 µg/mL LM609. Quantitative analysis of the effect of TH on protein expression levels of FAK (Y397) (D), Akt (S473) (E), and ERK1/2 (T202/Y204) (F). (G) Representative images of blots for pFAK, FAK, pAkt, Akt, pERK1/2, ERK1/2, and GAPDH levels in response to TH treatment after deletion of TRα. Quantitative analysis of the effect of TH on FAK (Y397) (H), Akt (S473) (I), and ERK1/2 (T202/Y204) protein expression levels (J). ImageJ Fiji software (NIH) was used to quantify the blots. Data are shown as the mean ± SEM and representative from at least three independent experiments. #### p < 0.0001, ### p < 0.001, ## p < 0.01 and # p < 0.05 indicate statistical significance according to two-way ANOVA continued with post hoc Turkey test compared to control. ****p < 0.0001, ***p < 0.001 and **p < 0.01 indicate statistical significance according to two-way or one-way ANOVA continued with post hoc Turkey test. See Supplementary Table 1 .

