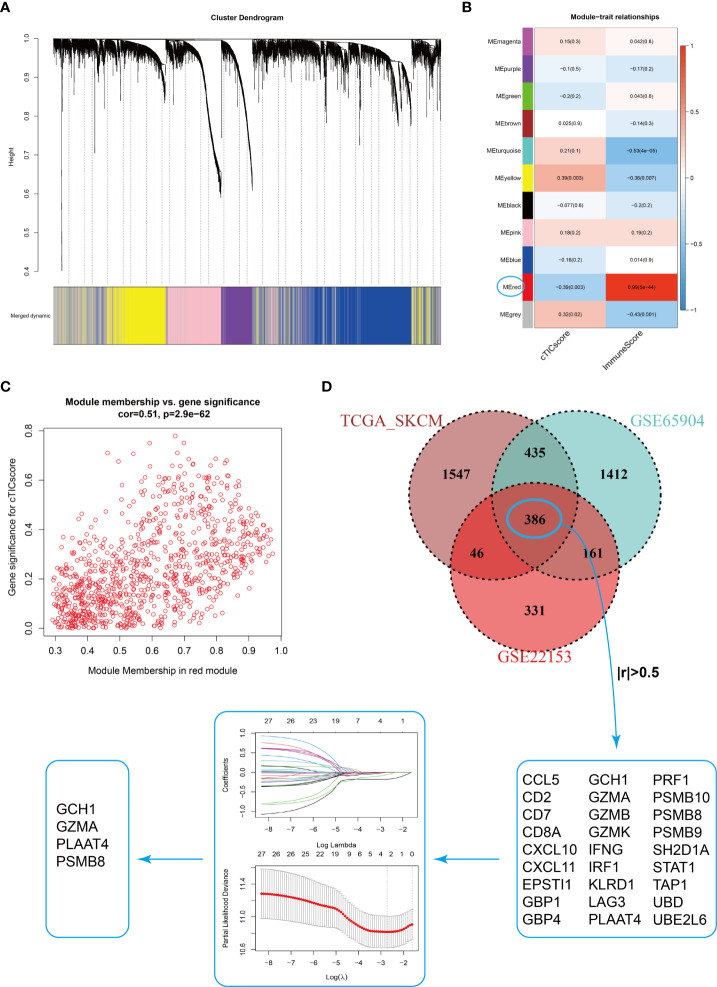
Figure 2.
Identification of four signature genes in CM TME. (A) Merging of mRNA co-expression modules. (B) Correlation heatmap of module genes and cTICscore or Immunescore in the GSE22153 dataset. The correlation coefficient changed from –1 to 1 as the color turned from blue to red gradually. (C) Scatterplot of the correlation coefficient between the selected module (red module) and the cTICscore. (D) Flowchart of the identification of four signature genes in CM TME. A total of 386 genes were shared in the selected modules from TCGA_SKCM, GSE65904, and GSE22153, and 27 of these genes strongly correlated (absolute coefficient > 0.5) in expression with the cTICscore across all three datasets. The 27 genes were input into a LASSO regression model, which generated four crucial genes for further analysis.

