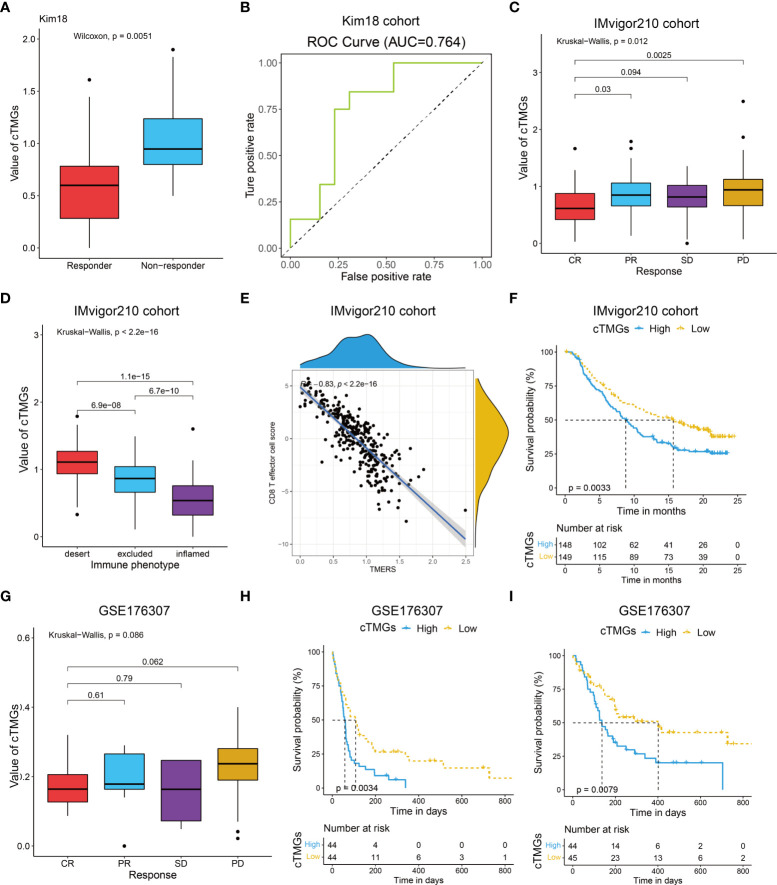
Figure 7.
Performance of the cTMGs for predicting the effect of ICI therapy on non-CM patients. (A) Box plot showing a difference in the value of cTMGs across the two response subtypes for patients with gastric cancer in the Kim18 cohort. (B) ROC curve showing the performance of the cTMGs for predicting the effect of pembrolizumab therapy on patients with gastric cancer in the Kim18 cohort. (C) Box plot showing differences in the value of cTMGs across the four response subtypes of the IMvigor210 study. (D) Box plot showing differences in the value of the cTMGs across the three immune phenotype subtypes of the IMvigor210 study. (E) Scatter plot showing the correlation between CD8 T effector cell score and cTMGs in the IMvigor210 study. (F) OS of patients with UC in the IMvigor210 study stratified by cTMGs subtype classification. (G) Box plot showing differences in the value of cTMGs across the four response subtypes for the GSE176307 dataset. (H, I) OS (H) and PFS (I) of patients with UC in the GSE176307 dataset stratified by cTMGs subtype classification.

