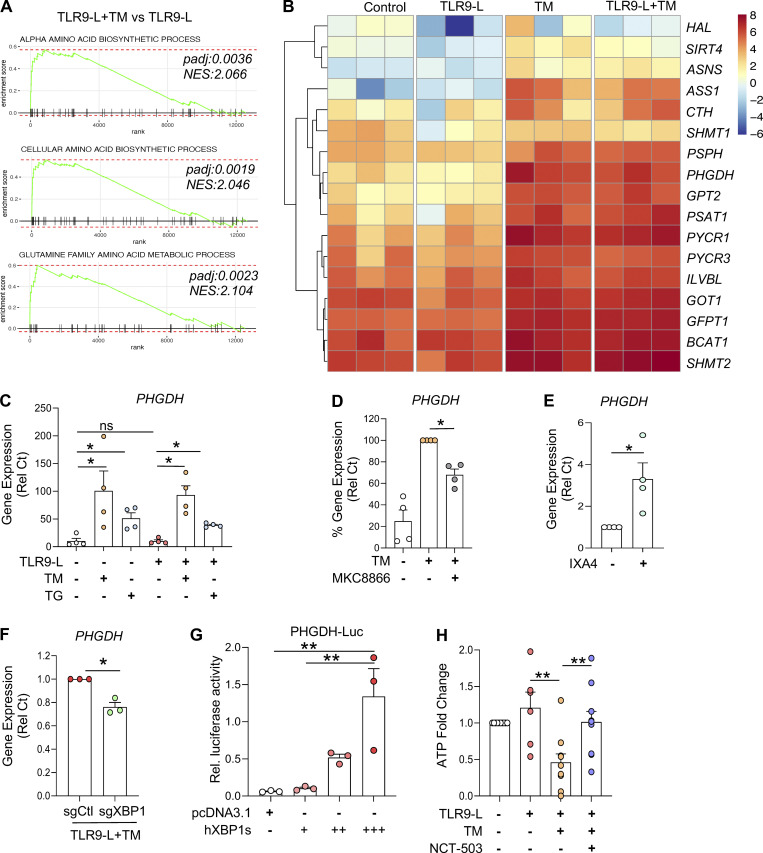
Figure 3.
ER stress response regulates ATP production via induction of PHGDH. (A and B) Purified pDCs from HDs (n = 3) were cultured in medium alone or with TM for 3 h, before addition of TLR9 agonist for 5 h. (A) Gene enrichment score of amino acid biosynthesis. (B) Heatmaps of genes involved in amino acid biosynthesis. NES, normalized enrichment score. (C) pDCs (n = 4) were cultured in medium alone or with TM or TG for 3 h, before addition of TLR9 agonist for 5 h. Gene expression of PHGDH was quantified. (D) pDCs (n = 4) were cultured with TM alone or in combination with an IRE1α inhibitor (MKC8866 at 1 μM) for 8 h. Gene expression level of PHGDH was quantified and normalized to TM treatment. (E) pDCs (n = 4) were cultured in medium alone or with IRE1α-XBP1 agonist (IXA4 at 30 µM) for 6 h. Gene expression level of PHGDH was quantified and normalized to medium. (F) pDCs (n = 3) were electroporated with Cas9–sgRNA complex targeting XBP1 and cultured with IL-3 (20 ng/ml) for 72 h. TM was added to culture for 3 h, before addition of the TLR9 agonist (CpG-C274 at 0.3 µM) for 5 h. Gene expression levels of PHGDH were quantified. Statistical significance was evaluated using two-tailed paired t test. *, P < 0.05. (G) HEK293T cells (n = 3) were cultured for 24 h in a 96-well plate and cotransfected with an PHGDH-Luc reporter plasmid and Renilla reporter plasmid with either expression vectors pcDNA3.1 or expression vectors with spliced XBP1 proteins (18 ng [+], 54 ng [++], or 90 ng [+++]). After 48 h of transfection, dual-luciferase reporter assay was performed, and PHGDH-Luc activity was normalized to Renilla Luc activity. (H) pDCs (n = 10) were cultured with TM in combination with PHGDH inhibitor (NCT-503 at 2 μM) for 3 h, before addition of the TLR9 agonist for 2.5 h. Intracellular ATP was quantified and normalized to medium. Individual donors are indicated, all results are represented as mean ± SEM, and statistical significance was evaluated using Mann–Whitney U test. ns, P > 0.05; *, P < 0.05; **, P < 0.01.

