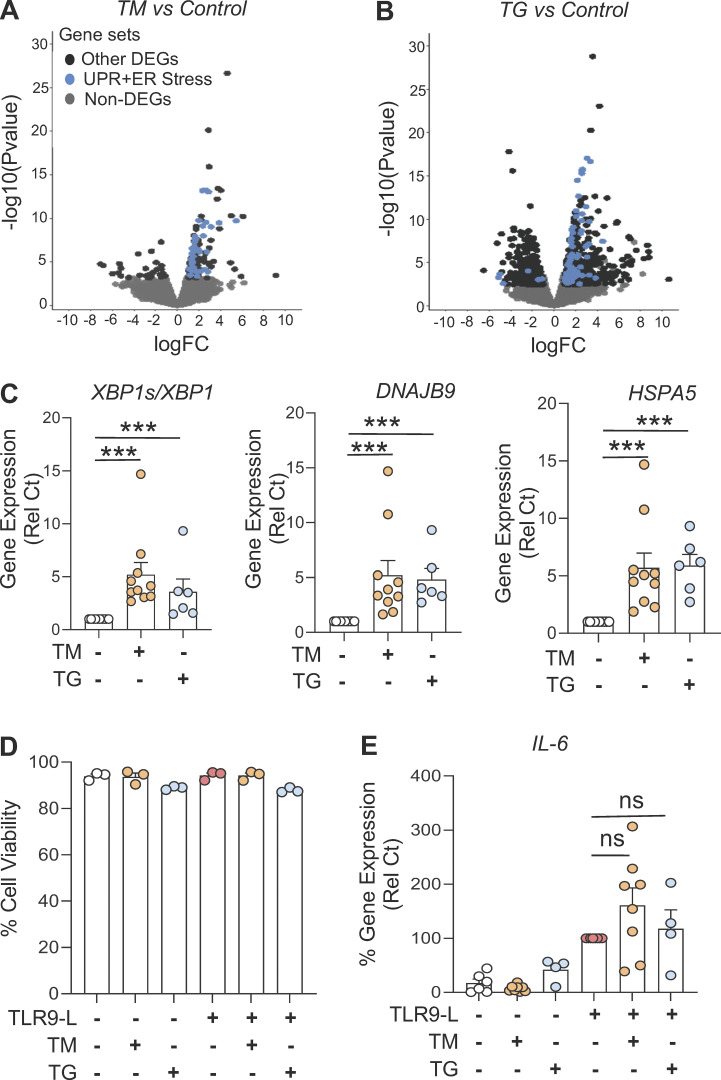
Figure S1.
Activated UPR impacts pDC response by reducing IFN-regulated genes. (A and B) Volcano plot comparing gene expression analyzed by RNA-seq of human pDCs (n = 3) from HDs cultured for 8 h in medium alone or with either TM (at 3 µg/ml; A) or TG (at 0.5 µM; B). Colors on all graphs indicate differentially expressed genes (DEGs), and UPR+ER stress genes (in blue) are indicated. logFC, log(fold-change). (C) pDCs (n = 10) were cultured in medium alone or with either TM or TG. Gene expression levels of XBP1s/XBP1, DNAJB9, and HSPA5 were quantified by qPCR after 8 h of culture and normalized to medium. (D and E) pDCs (n = 3–8) were cultured in medium alone or with either TM or TG for 3 h, before addition of TLR9 agonist. (D) Cell viability was quantified via flow cytometer. (E) Gene expression level of IL-6 was quantified at 5 h and normalized to TLR9 agonist treatment. Individual donors are indicated, all results are represented as mean ± SEM, and statistical significance was evaluated using Mann–Whitney U test. ns, P > 0.05; ***, P < 0.001.

