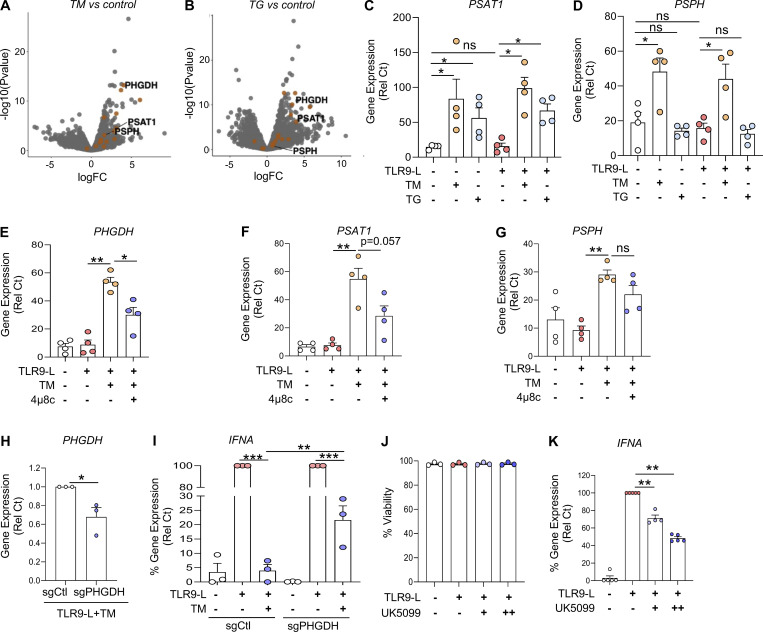
Figure S3.
ER stress induces serine biosynthesis in pDCs via PHGDH. (A and B) Volcano plots comparing gene expression analyzed by RNA-seq of pDCs (n = 3) cultured for 8 h with either TM or TG vs. medium. (C and D) pDCs (n = 4) were cultured in medium alone or with either TM or TG for 3 h, before addition of TLR9 agonist for 5 h. Gene expression of PHGDH, PSAT1, and PSPH was quantified by qPCR. (E–G) pDCs (n = 4) were cultured in medium alone or with TM, either alone or in combination with an IRE1⍺ inhibitor (4μ8c at 10 µM) for 3 h, before addition of TLR9 agonist for 5 h. Gene expression of PHGDH, PSAT1, and PSPH was quantified by qPCR. (H and I) pDCs (n = 3) were electroporated with Cas9–sgRNA complex targeting PHGDH and cultured with IL-3 (20 ng/ml) for 72 h. TM was added to culture for 3 h, before addition of the TLR9 agonist (CpG-C274 at 0.3 µM) for 5 h. (H) Gene expression levels of PHGDH were quantified. (I) Gene expression levels of IFNA were quantified and normalized to TLR9 agonist treatment. (J and K) pDCs (n = 3–5) were cultured in medium alone or with inhibitor for pyruvate transporter (UK-5099 at 20 µM [+] or 40 µM [++]) for 1 h, before addition of the TLR9 agonist. (J) Cell viability was quantified at 5 h via flow cytometer. (K) Gene expression level IFNA was quantified and normalized to TLR9 agonist. Individual donors are indicated, all results are represented as mean ± SEM, and statistical significance was evaluated using Mann–Whitney U test, two-tailed paired t test, or one-way ANOVA with Turkey’s correction. ns, P > 0.05; *, P < 0.05; **, P < 0.01; ***, P < 0.001.

