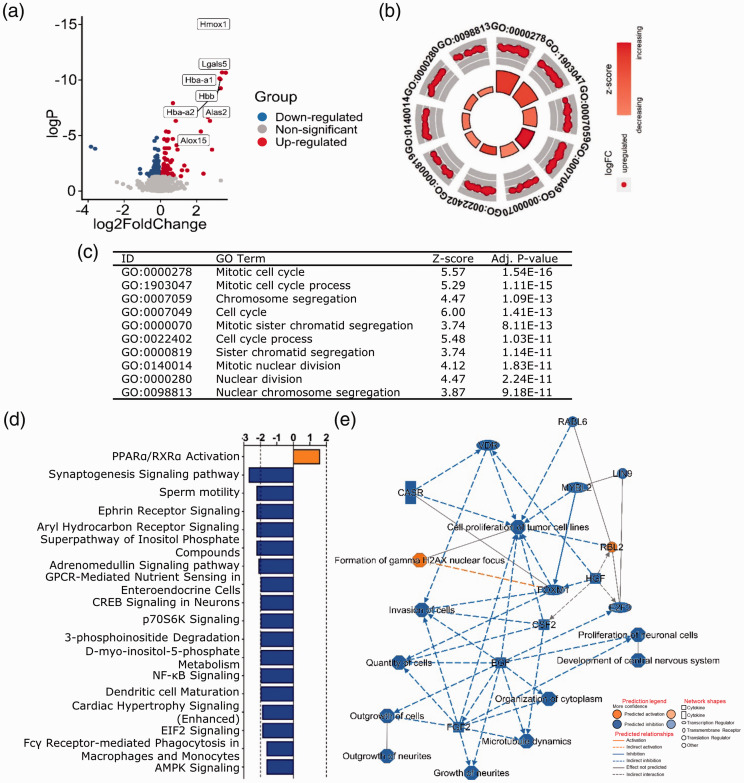
Figure 3.
At 24 hours after GMH, cell cycle-related processes were the most significantly enriched. (a) Volcano plot of DEGs at 24 hours after GMH. P-adj <0.001 and |(log2FoldChange)| > 1. (b–c) GOplot displaying the most significantly enriched GO biological processes. The canonical pathways (d) and graphical summary of the network (e) predicted by IPA.

