Figure 1.
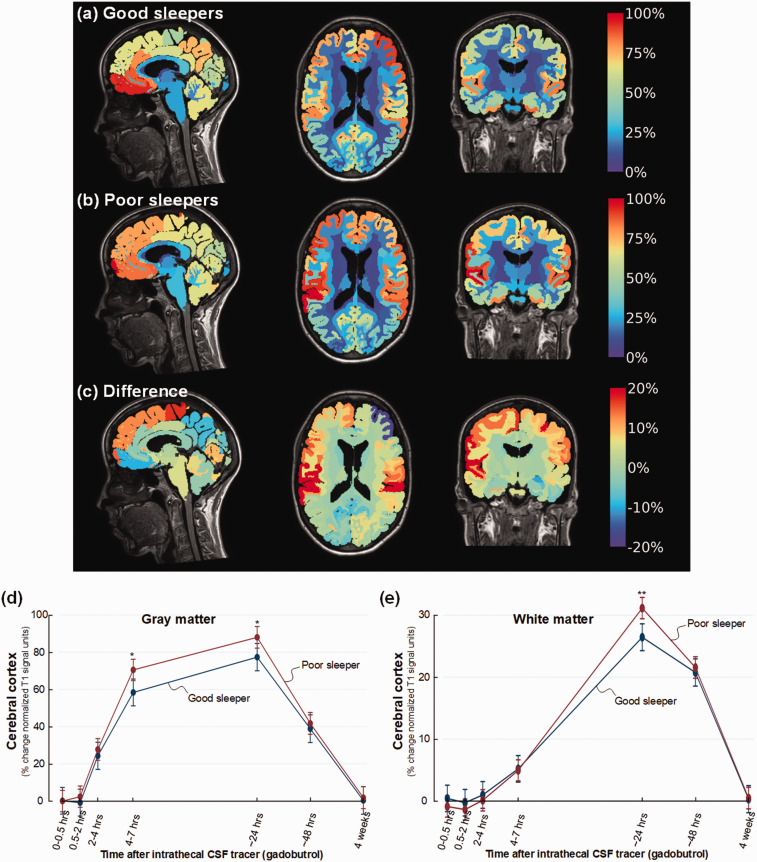
Color maps illustrating levels of CSF tracer enrichment in non-dementia individuals having good or poor sleep quality. For patient cohort #1 with no diagnosed dementia disease, CSF tracer enrichment in brain tissue is given as percentage increase of normalized T1 MRI signal units from baseline until 24 hours, and presented at a color scale. Tracer in CSF spaces has been subtracted. (a) The average increase in normalized cerebral T1 signal from baseline until 24 hours for the individuals with good sleep quality (PSQI score ≤5) is presented as mid-sagittal (left), mid-axial (middle), and mid-coronal (right) slices (n = 17; Good sleepers). (b) The average percentage normalized T1 signal increase from baseline until 24 hours is shown for the individuals with poor sleep quality (PSQI score >6) (n = 27; Poor sleepers). (c) The difference in percentage normalized T1 signal increase between Poor sleepers and Good sleepers is shown. The color maps demonstrate higher tracer levels in Poor sleepers with red color indicating the highest tracer levels, which we interpret as glymphatic enhancement. Blue color and negative values are indicative of accelerated clearance of tracer. (d) Trend plots of percentage change in normalized T1 signal unit within gray matter of cerebral cortex demonstrating significant differences between the Poor sleepers (red line) and Good sleepers (blue line) at 4–7 and 24 hours. (e) Trend plots of percentage change in normalized T1 signal units within white matter demonstrating significant differences between the Poor sleepers (red line) and Good sleepers (blue line) at 24 hours.*P < 0.05, **P < 0.01, ***P < 0.001. Trend plots show mean with error bars (95% confidence intervals) from linear mixed models.

